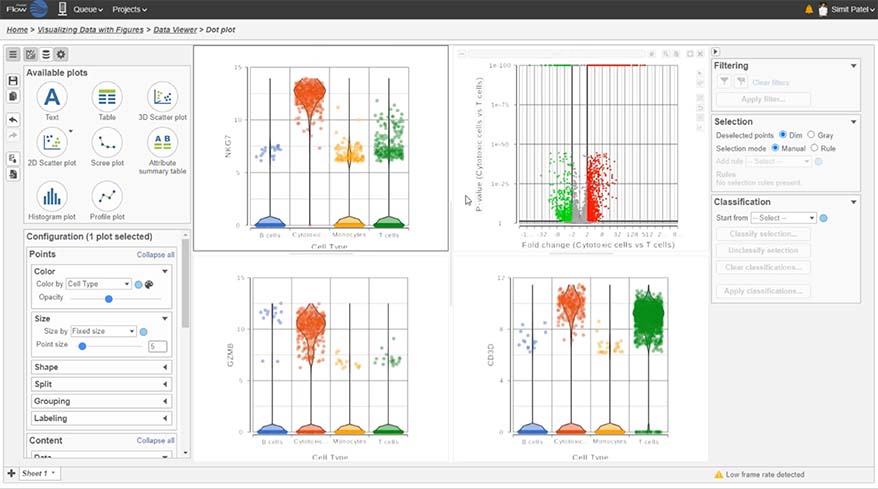
Single Cell RNA-Seq Data Analysis – Visualizing Data with Figures
Have you struggled to produce single cell visualizations or understand their meaning? This short webinar will show you how to produce and interpret figures from single cell RNA-Seq data in Partek Flow.
You will learn about:
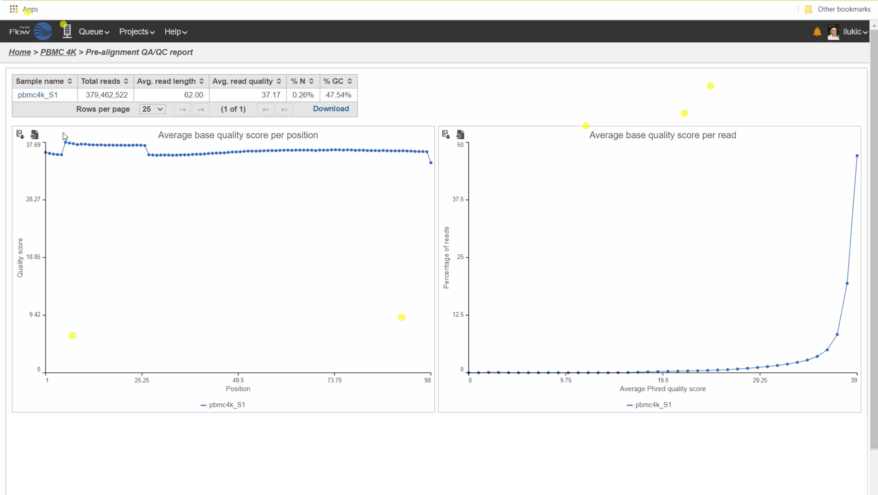
- Single Cell Data QA/QC plot
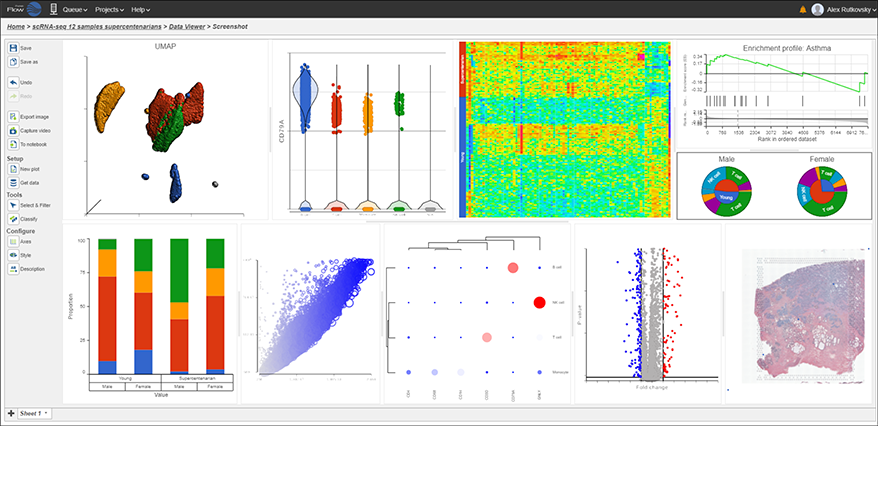
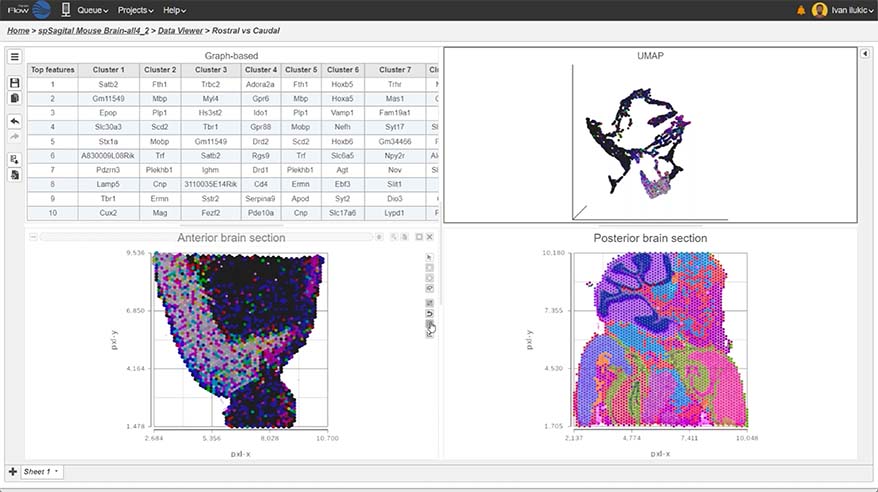
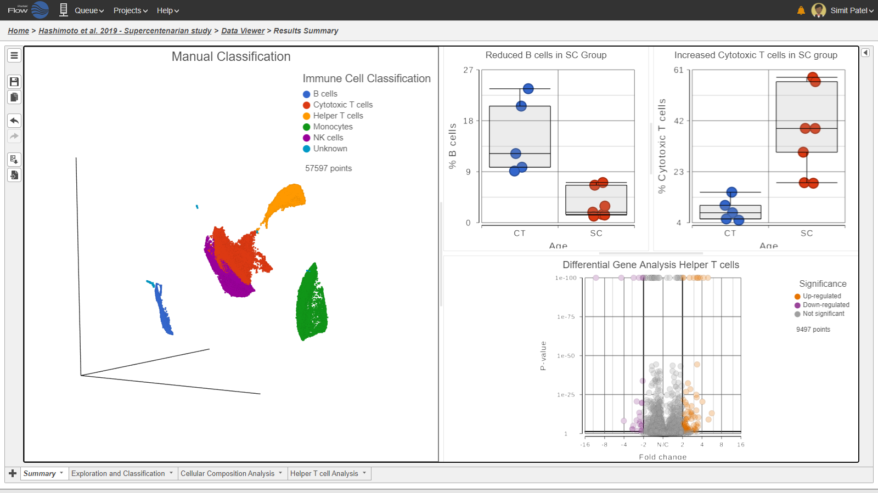
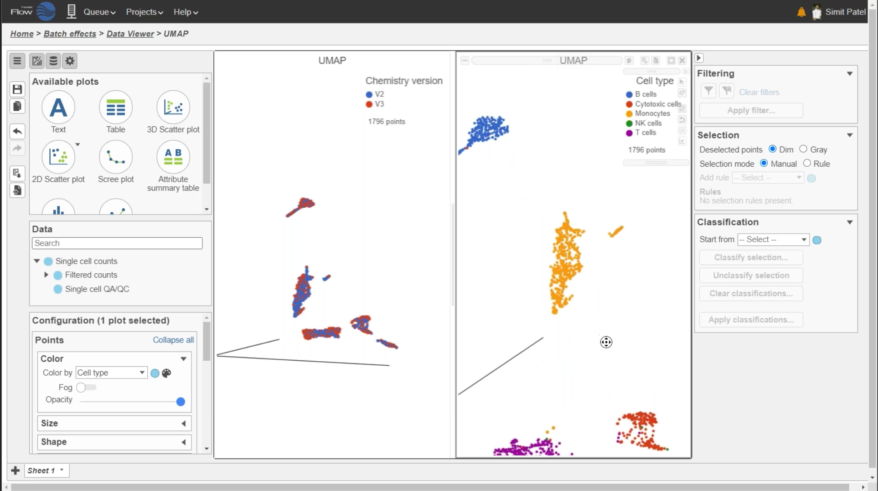
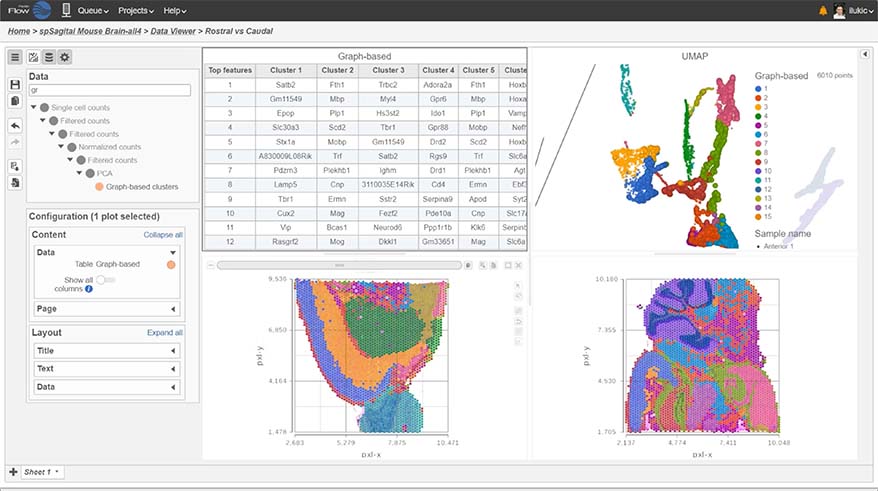
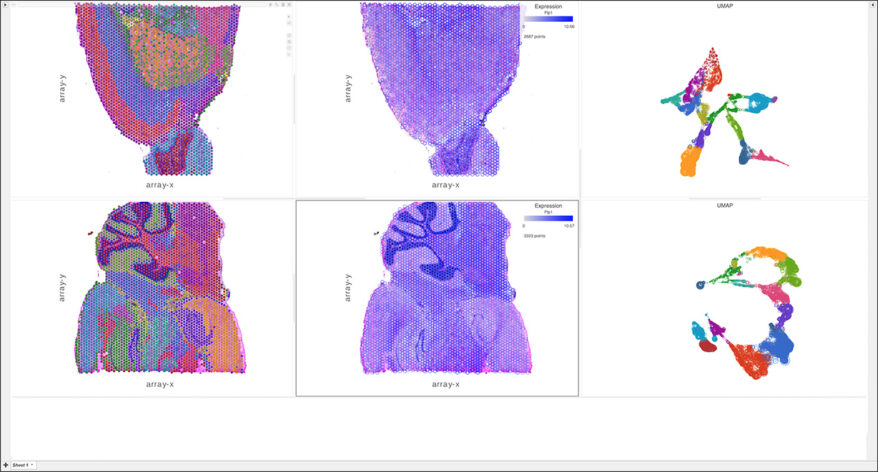
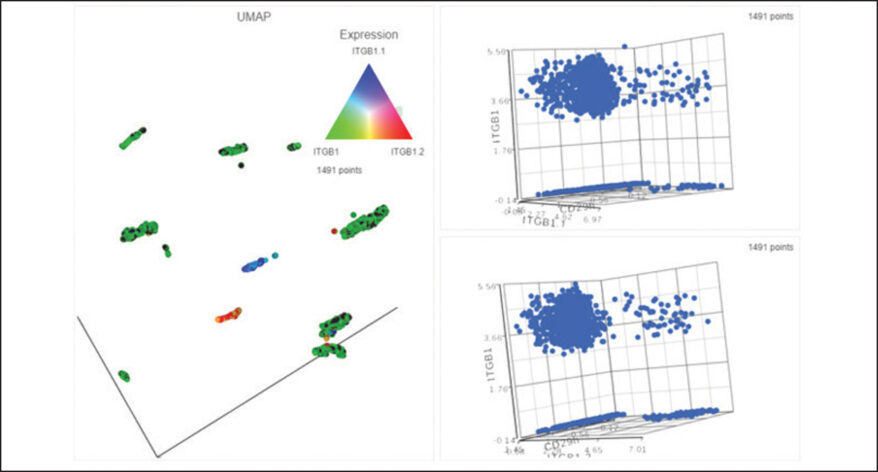
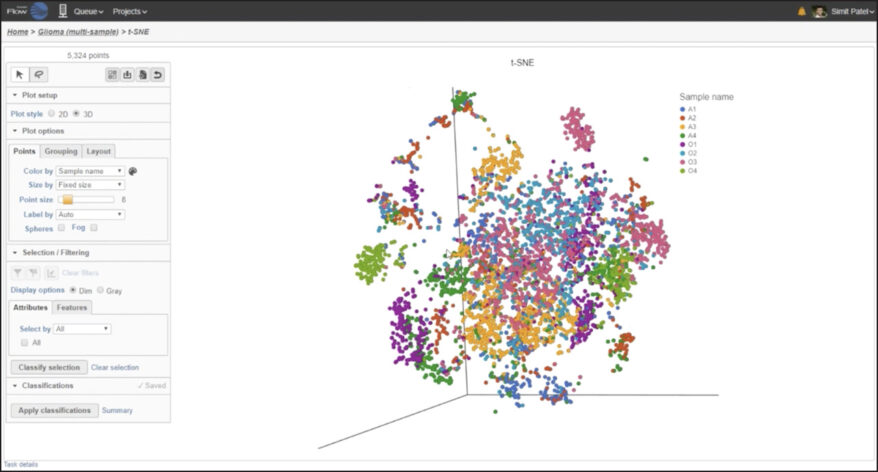
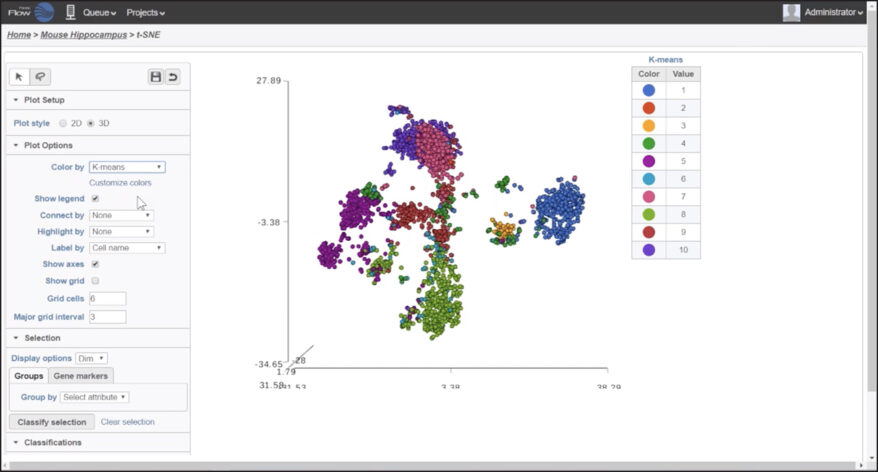
- UMAP
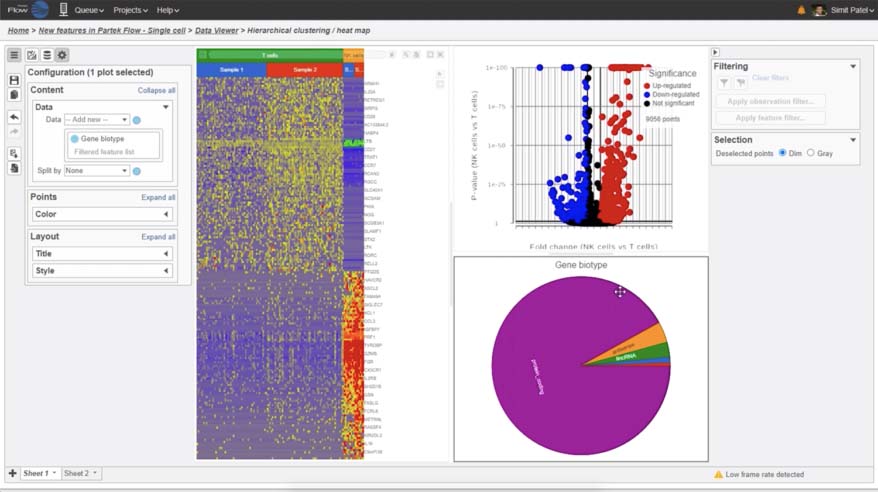
- Volcano plot
- Violin plot
- Heat map
Register to Watch
Our Single Cell Webinar Series


Share this post: