Spatial Transcriptomics
Spatial transcriptomics allows scientists to measure and map the location of gene activity in a tissue sample. It expands the gene expression context provided by RNA‑Seq and scRNA‑Seq techniques alone into holistic, three-dimensional cellular behavior.
Partek Flow software provides an easy‑to‑use interface, advanced statistical algorithms, and rich interactive visualizations for start‑to‑finish spatial transcriptomics analysis. It also allows you to analyze and integrate single cell RNA-Seq, CITE-Seq, antibody capture sequencing, cell hashing data, and more.
Covering the Complete Spatial Analysis Process
Supporting 10x Genomics® Visium® and Xenium®, NanoString® CosMx™, Akoya Biosciences®, and more in all standard formats.

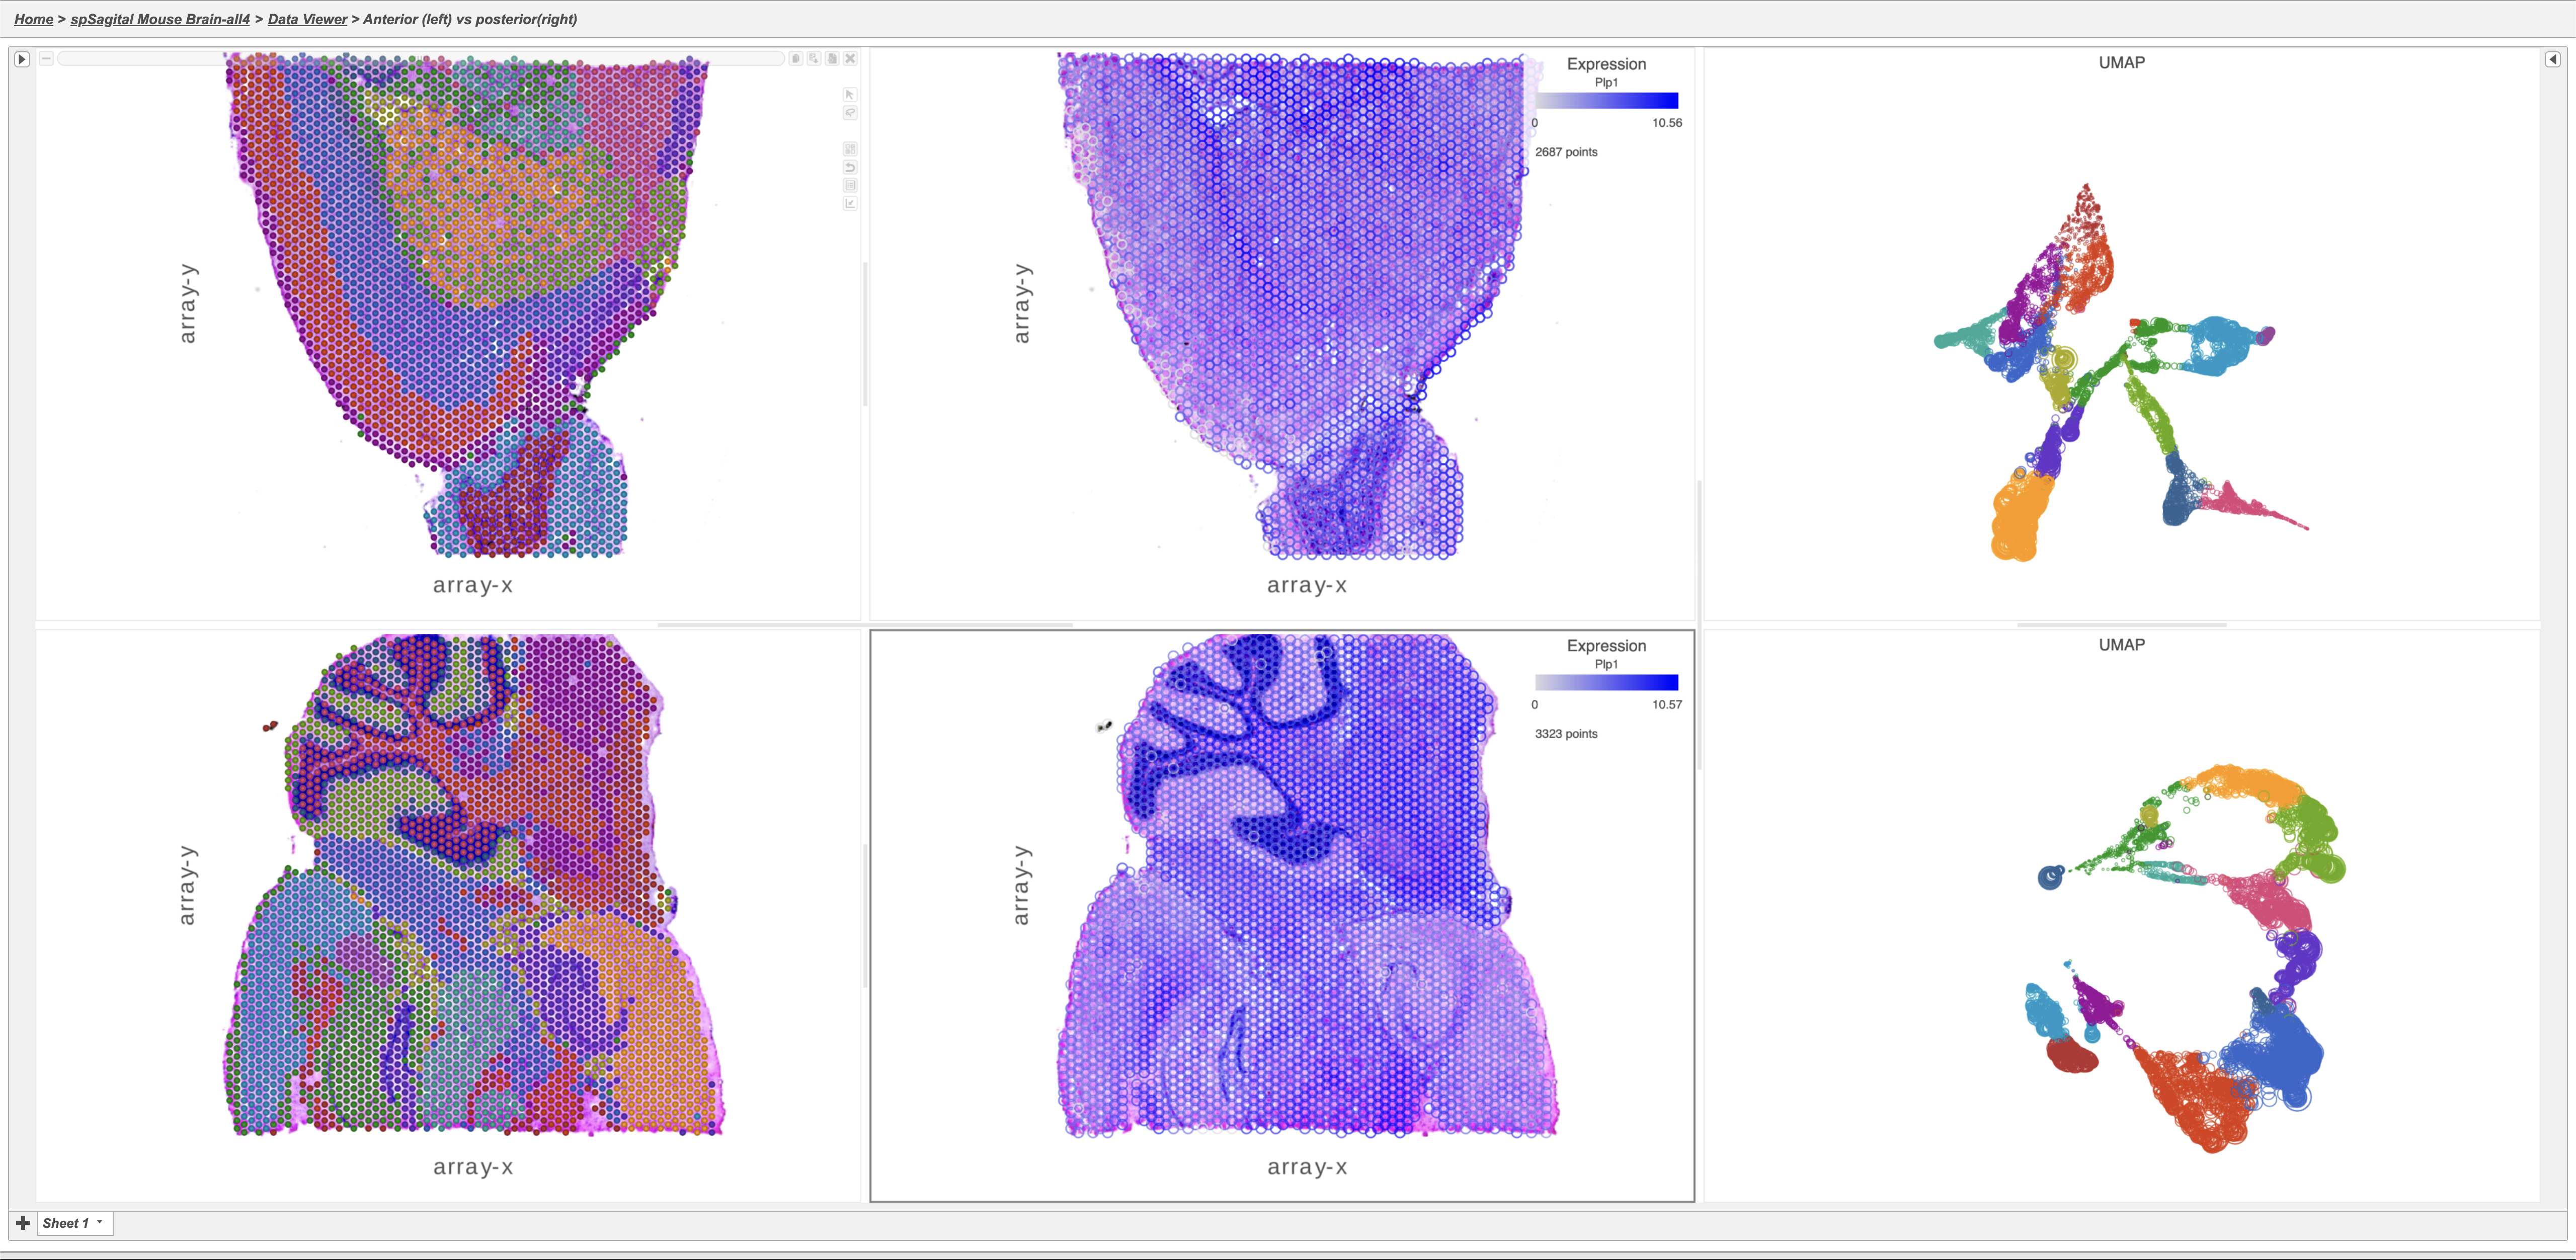
Integrated tissue and transcriptomics data with side-by-side visualizations in the Partek Flow Data Viewer.
Left: adult mouse brain slices (up: rostral section, down: caudal section). Result of graph-based clustering of gene expression data overlaid on tissue spots.
Center: adult mouse brain slices (up: rostral section, down: caudal section). Tissue spots are colored by the expression levels of Plp1 gene.
Right: UMAPs based on gene expression data of the rostral (top) and caudal (bottom) section. The colors represent graph-based clusters.
What You Can Do
- Analyze multiple samples together or independently
- Annotate cells from metadata
- Perform QA/QC
- Filter cell spots and features
- Perform data normalization
- Remove batch effects with multiple options (general linear model, Harmony, and Seurat 3 integration)
- Spatially visualize and analyze gene expression
- Perform dimension reduction, graph-based clustering, and interactively explore clusters in their spatial context
- Discover biomarkers that define a tissue or cluster
- Find differentially expressed genes in any region of interest
- Perform gene ontology and pathway analysis
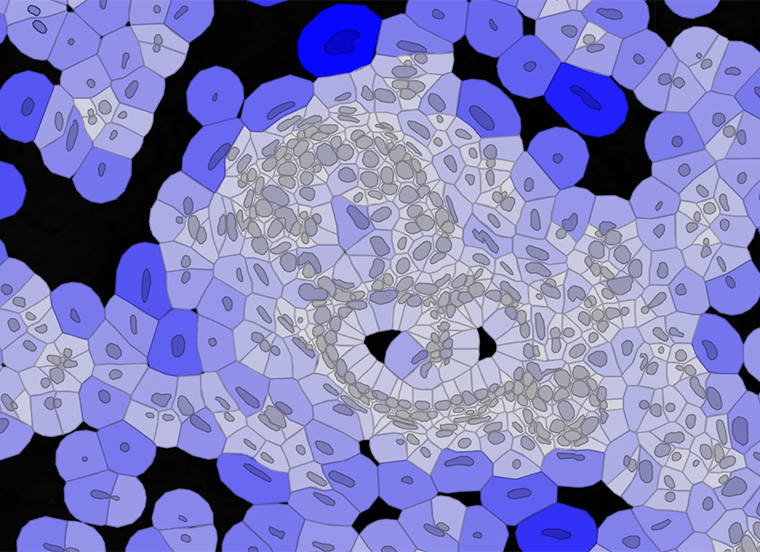
Human Ductal Carcinoma In Situ (DCIS) sample in Partek Flow using 10x Genomics Xenium technology. The cells are colored by cell type.
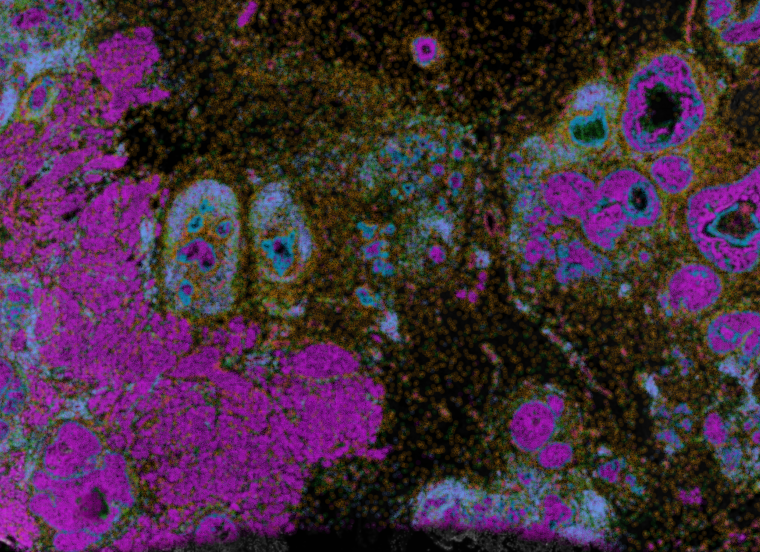
Data from 10x Genomics Xenium – Cells are colored by gene or protein expression, and augmented with the boundaries of the cell and nucleus.
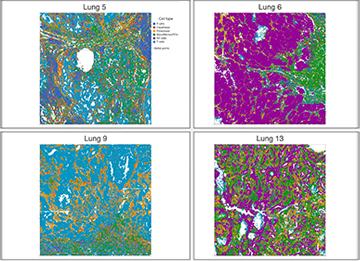
Four tissue samples from human lungs profiled using the Nanostring CosMx technology. Cells are colored by cell type.
Powerful Tools & Features in an Easy-to-Use Application:
 |
Cell Type Classification Manually classify your cells by traditional methods or perform automatic cell classification using regression-based methods for human and mouse. |
 |
Comprehensive QA/QC Tools Evaluate the status of your analysis and optimize downstream viability using a variety of quality assurance/control tools and reports. |
 |
Visualize and integrate tissue with transcriptomic data Characterize gene and protein expression in their native spatial context for a detailed map of tissue architecture. |
| Answer biological questions using spatial morphology Overlay gene expression data to visualize spatial relationships in a biological context. |
 |
Explore Multiple Samples Simultaneously Analyze and visualize multiple samples together or independently and discover biological variations with combined and split-by-sample analysis. |
 |
Detect Differential Expression Patterns Powerful statistical analysis tools help you determine patterns and markers in datasets, including genes, proteins, and pathways. |
 |
Investigate Gene Set and Pathway Enrichment Learn about the biology underlying gene expression changes using gene ontology (GO) or pathway enrichment analysis. |
 |
Define and compare cell populations through biomarker discovery Take advantage of extensive statistical models to make make meaningful comparisons using biomarkers to define a cell population, condition, or another parameter within your study. |
Spatial Webinars