Proteomics
Cell fate decisions are largely driven by protein networks, although currently mRNA levels are widely used as a proxy for protein expression. Proteomics allows the quantification of global (at bulk and single cell levels) proteomes to provide direct molecular inference for cell functions. By analyzing the expression levels of different proteins in healthy and diseased tissues, researchers can identify potential biomarkers for early disease detection, diagnosis, and prognosis.
With an easy-to-use interface, Partek Flow provides comprehensive genomic and proteomic data analysis. You can import an ADAT file for Somalogic data, a .txt file for Olink data, a .txt(.csv)/.fcs file for mass cytometry data or Akoya spatial proteomics data, and perform various exploratory data analytic processes.
Covering the Complete Proteomic Analysis Process

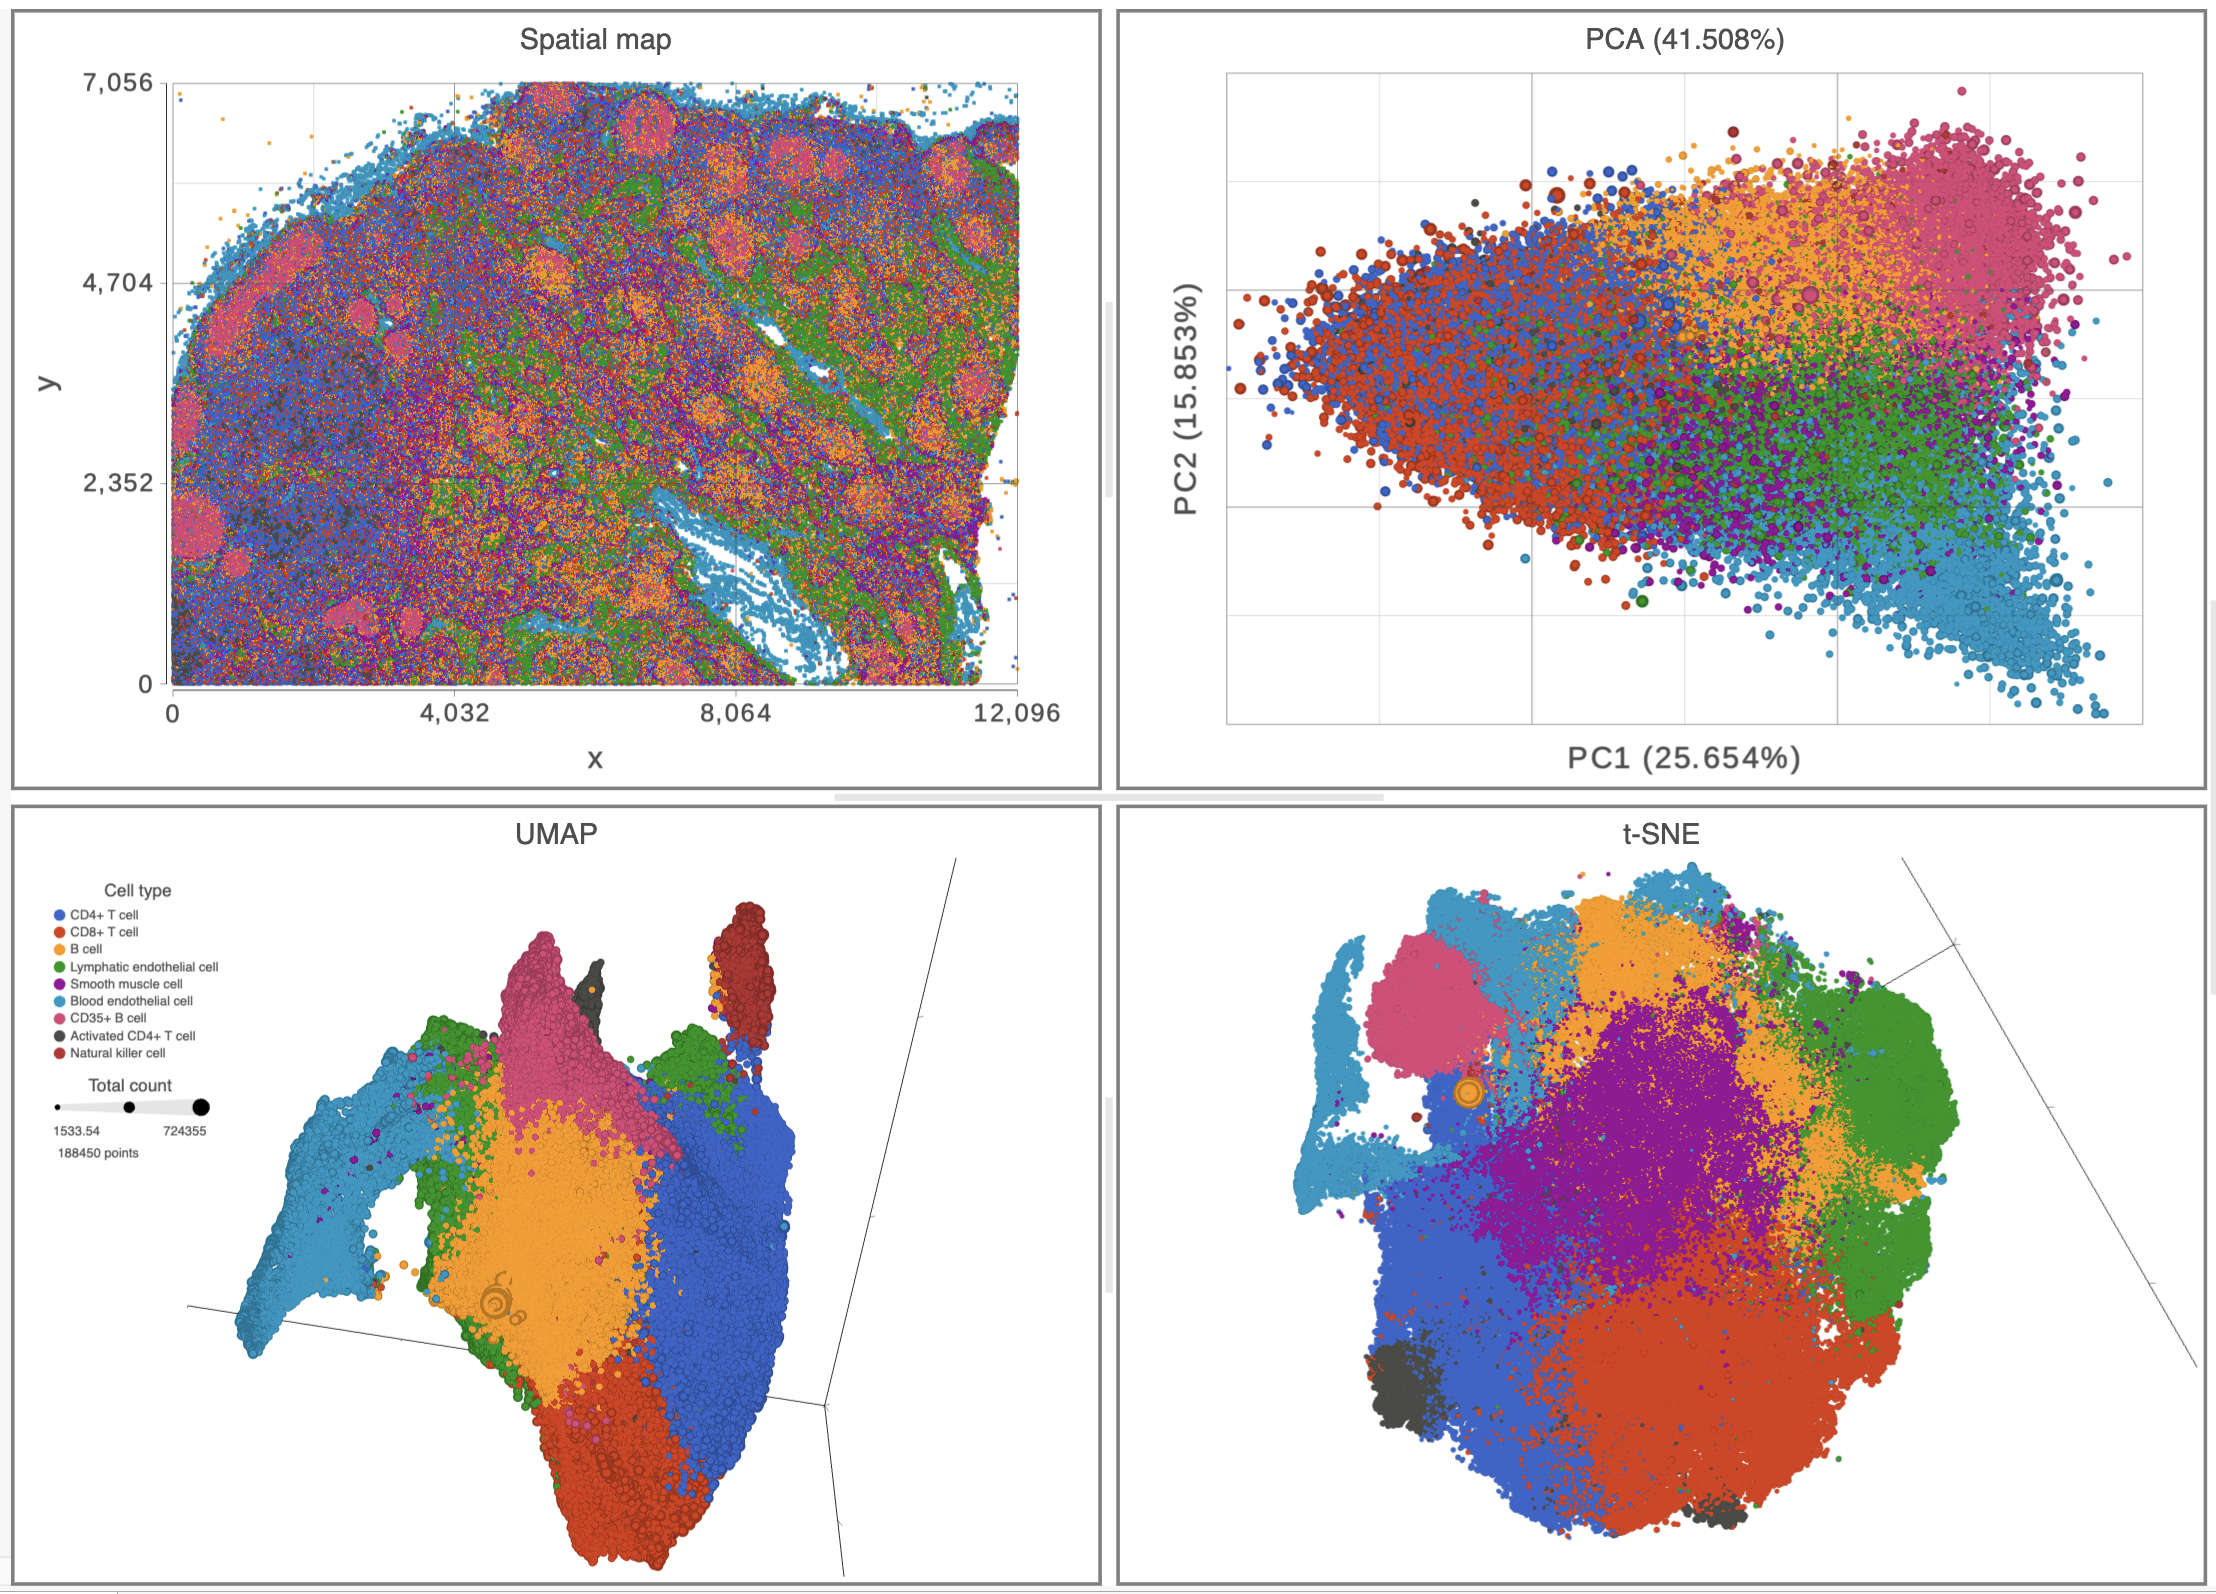 Top left: spatial map colored with different cell types indicating the position for each cell. Top right: PCA plot colored by different cell types showing >41% of variances explained by the first two components. Bottom half: 3D UMAP and t-SNE plots are both colored by different cell types and sized by total count in each cell.
What You Can Do
- Filter data to samples/cells/features with desired characteristics
- Impute missing data
- Normalize data
- Perform dimension reduction
- Perform clustering analysis
- Create interactive plots
- Perform statistical analysis including correlation, similarity analysis
- Identify differentially expressed proteins between healthy and diseased tissues or different cell types
- Gain deeper insights through pathway analysis and enrichment analysis
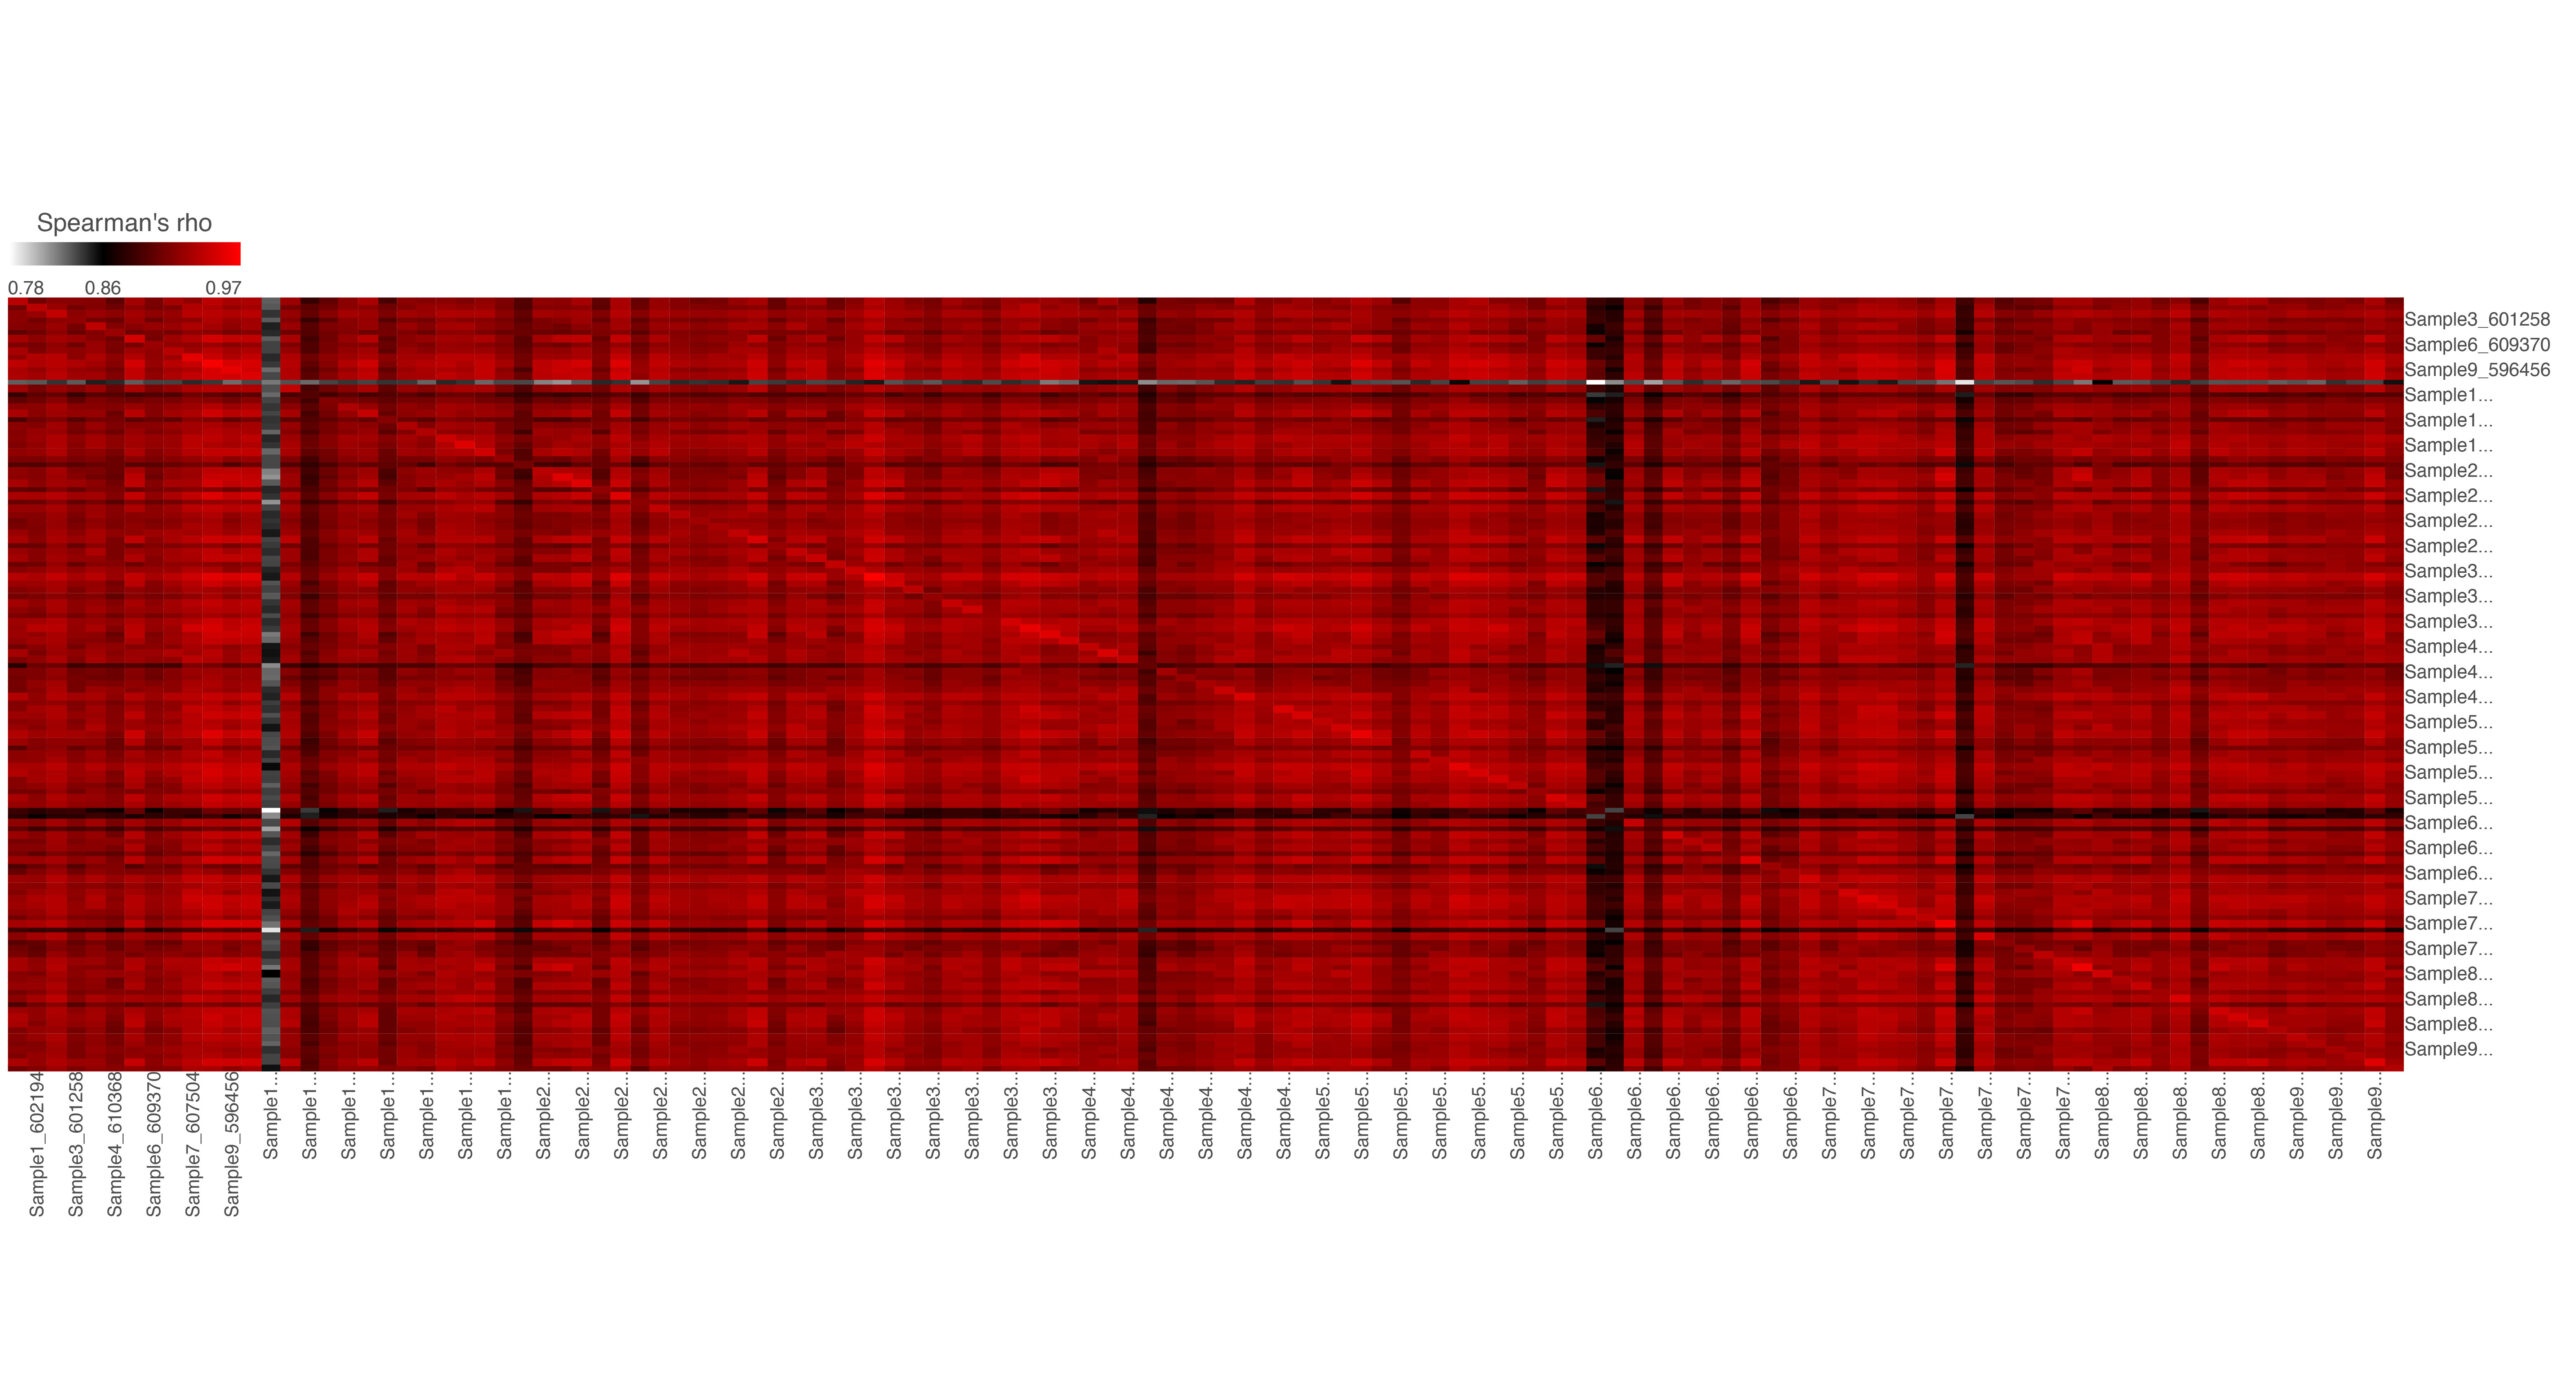 Similarity matrix analysis displays the correlation of every sample versus every other sample. The result is a matrix with the same set of samples on rows and columns. The value in the matrix is the correlation coefficient (–r) from Spearman’s rho.
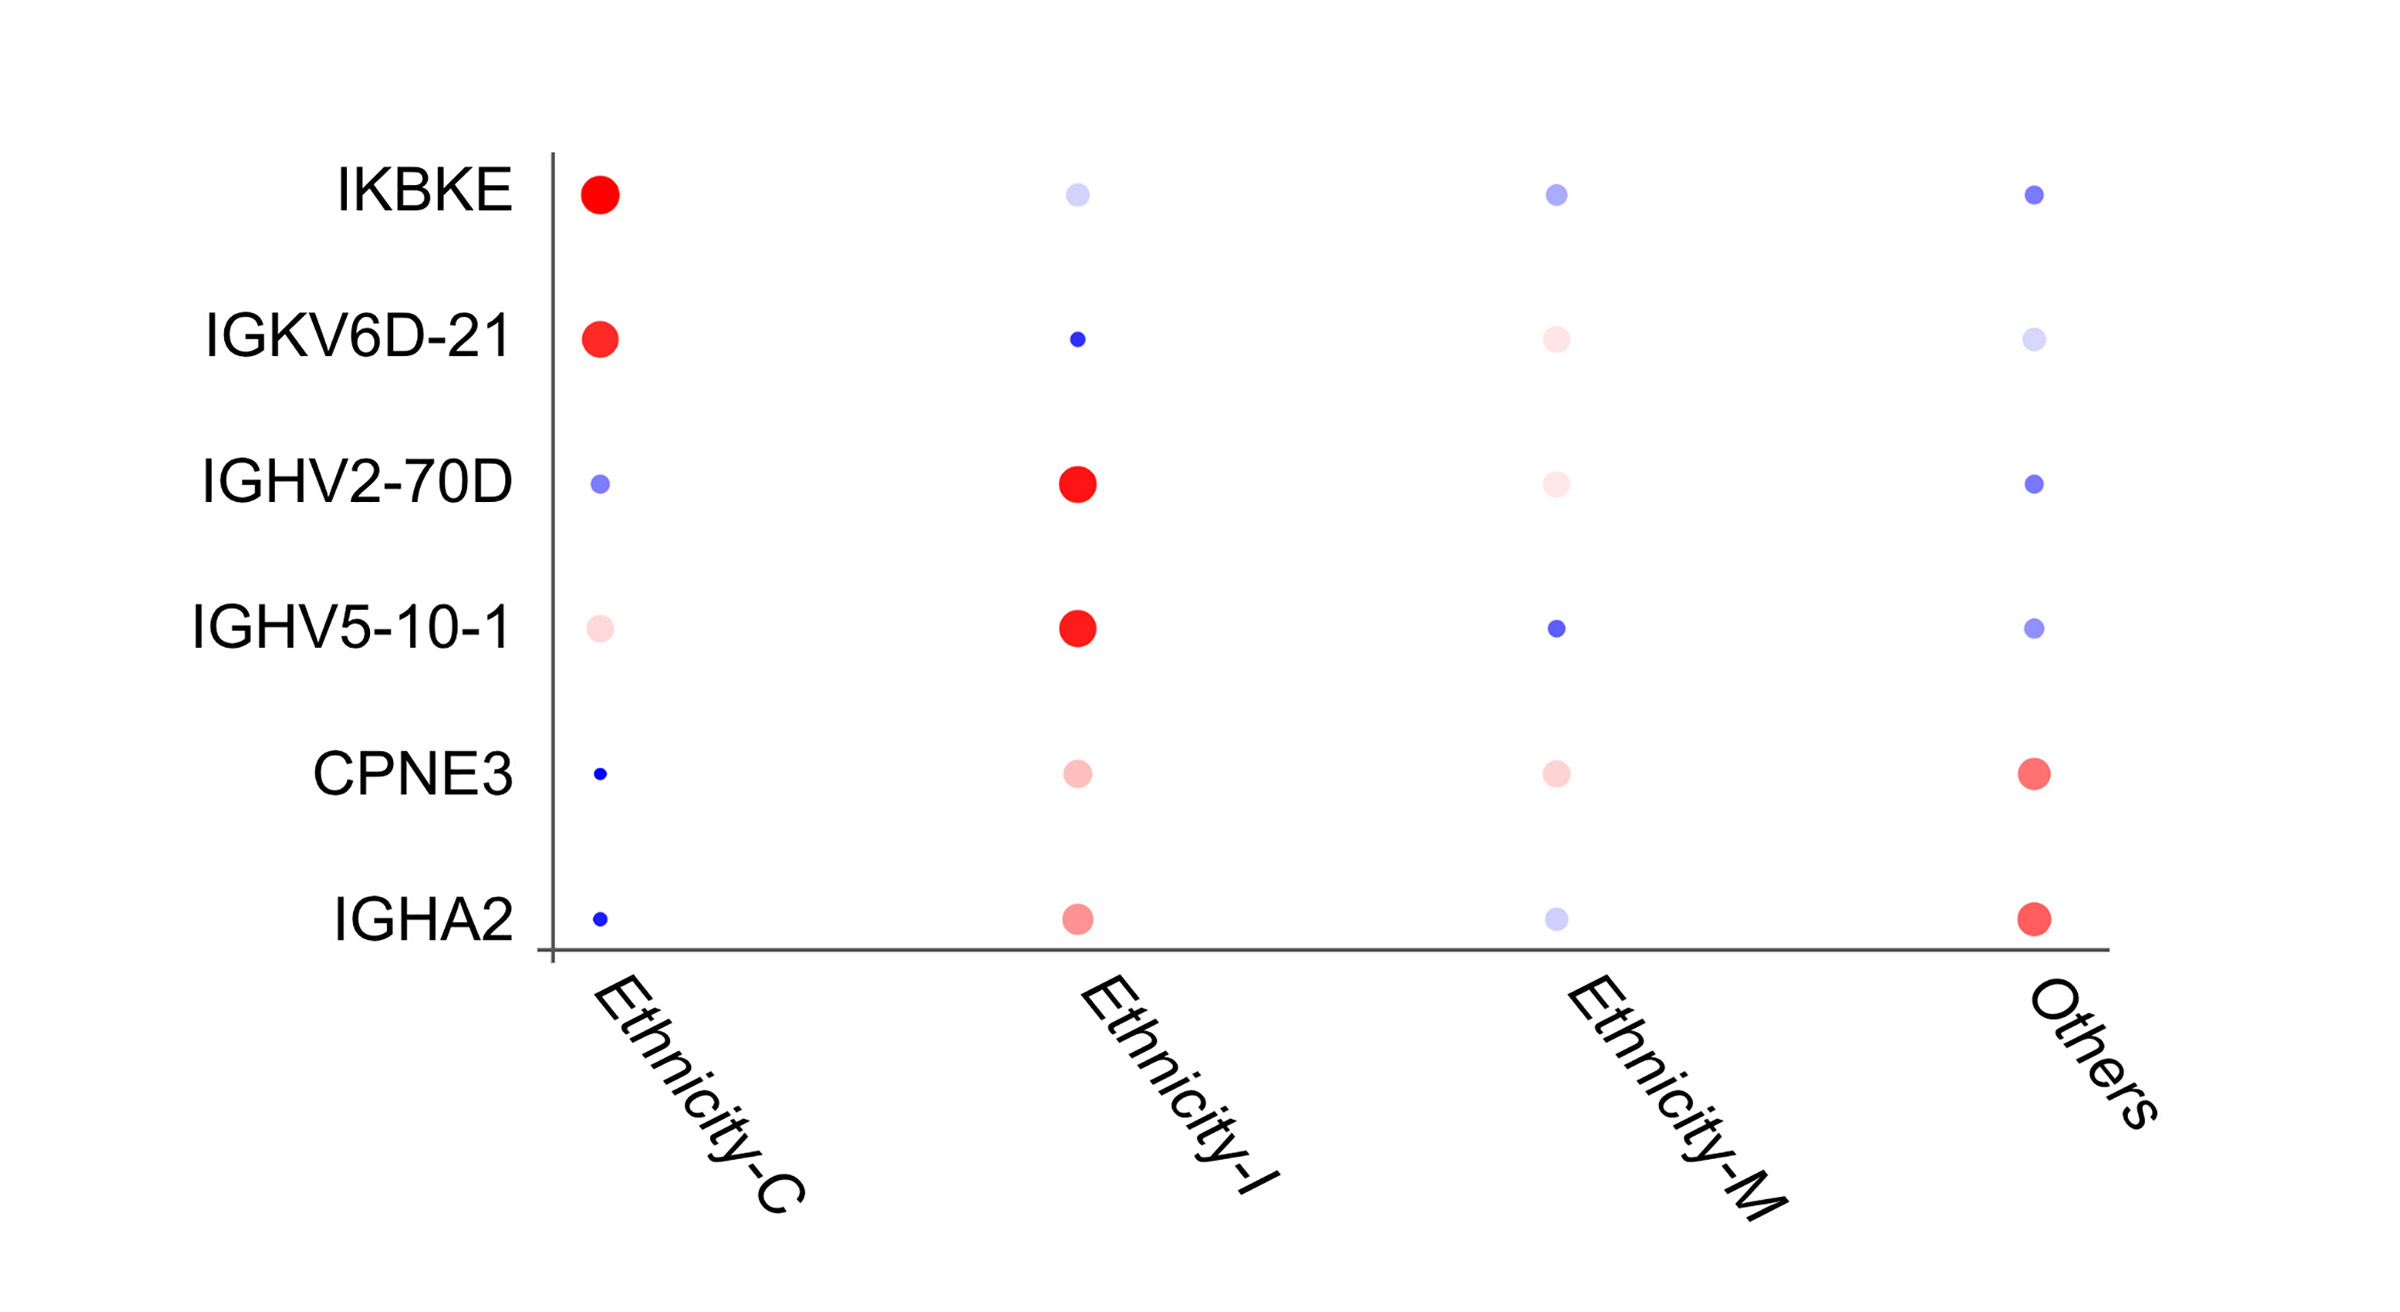 Bubble plot illustrating differential expression of protein markers among ethnic groups. Colored by the average expression value of all cells in the specific ethnicity.
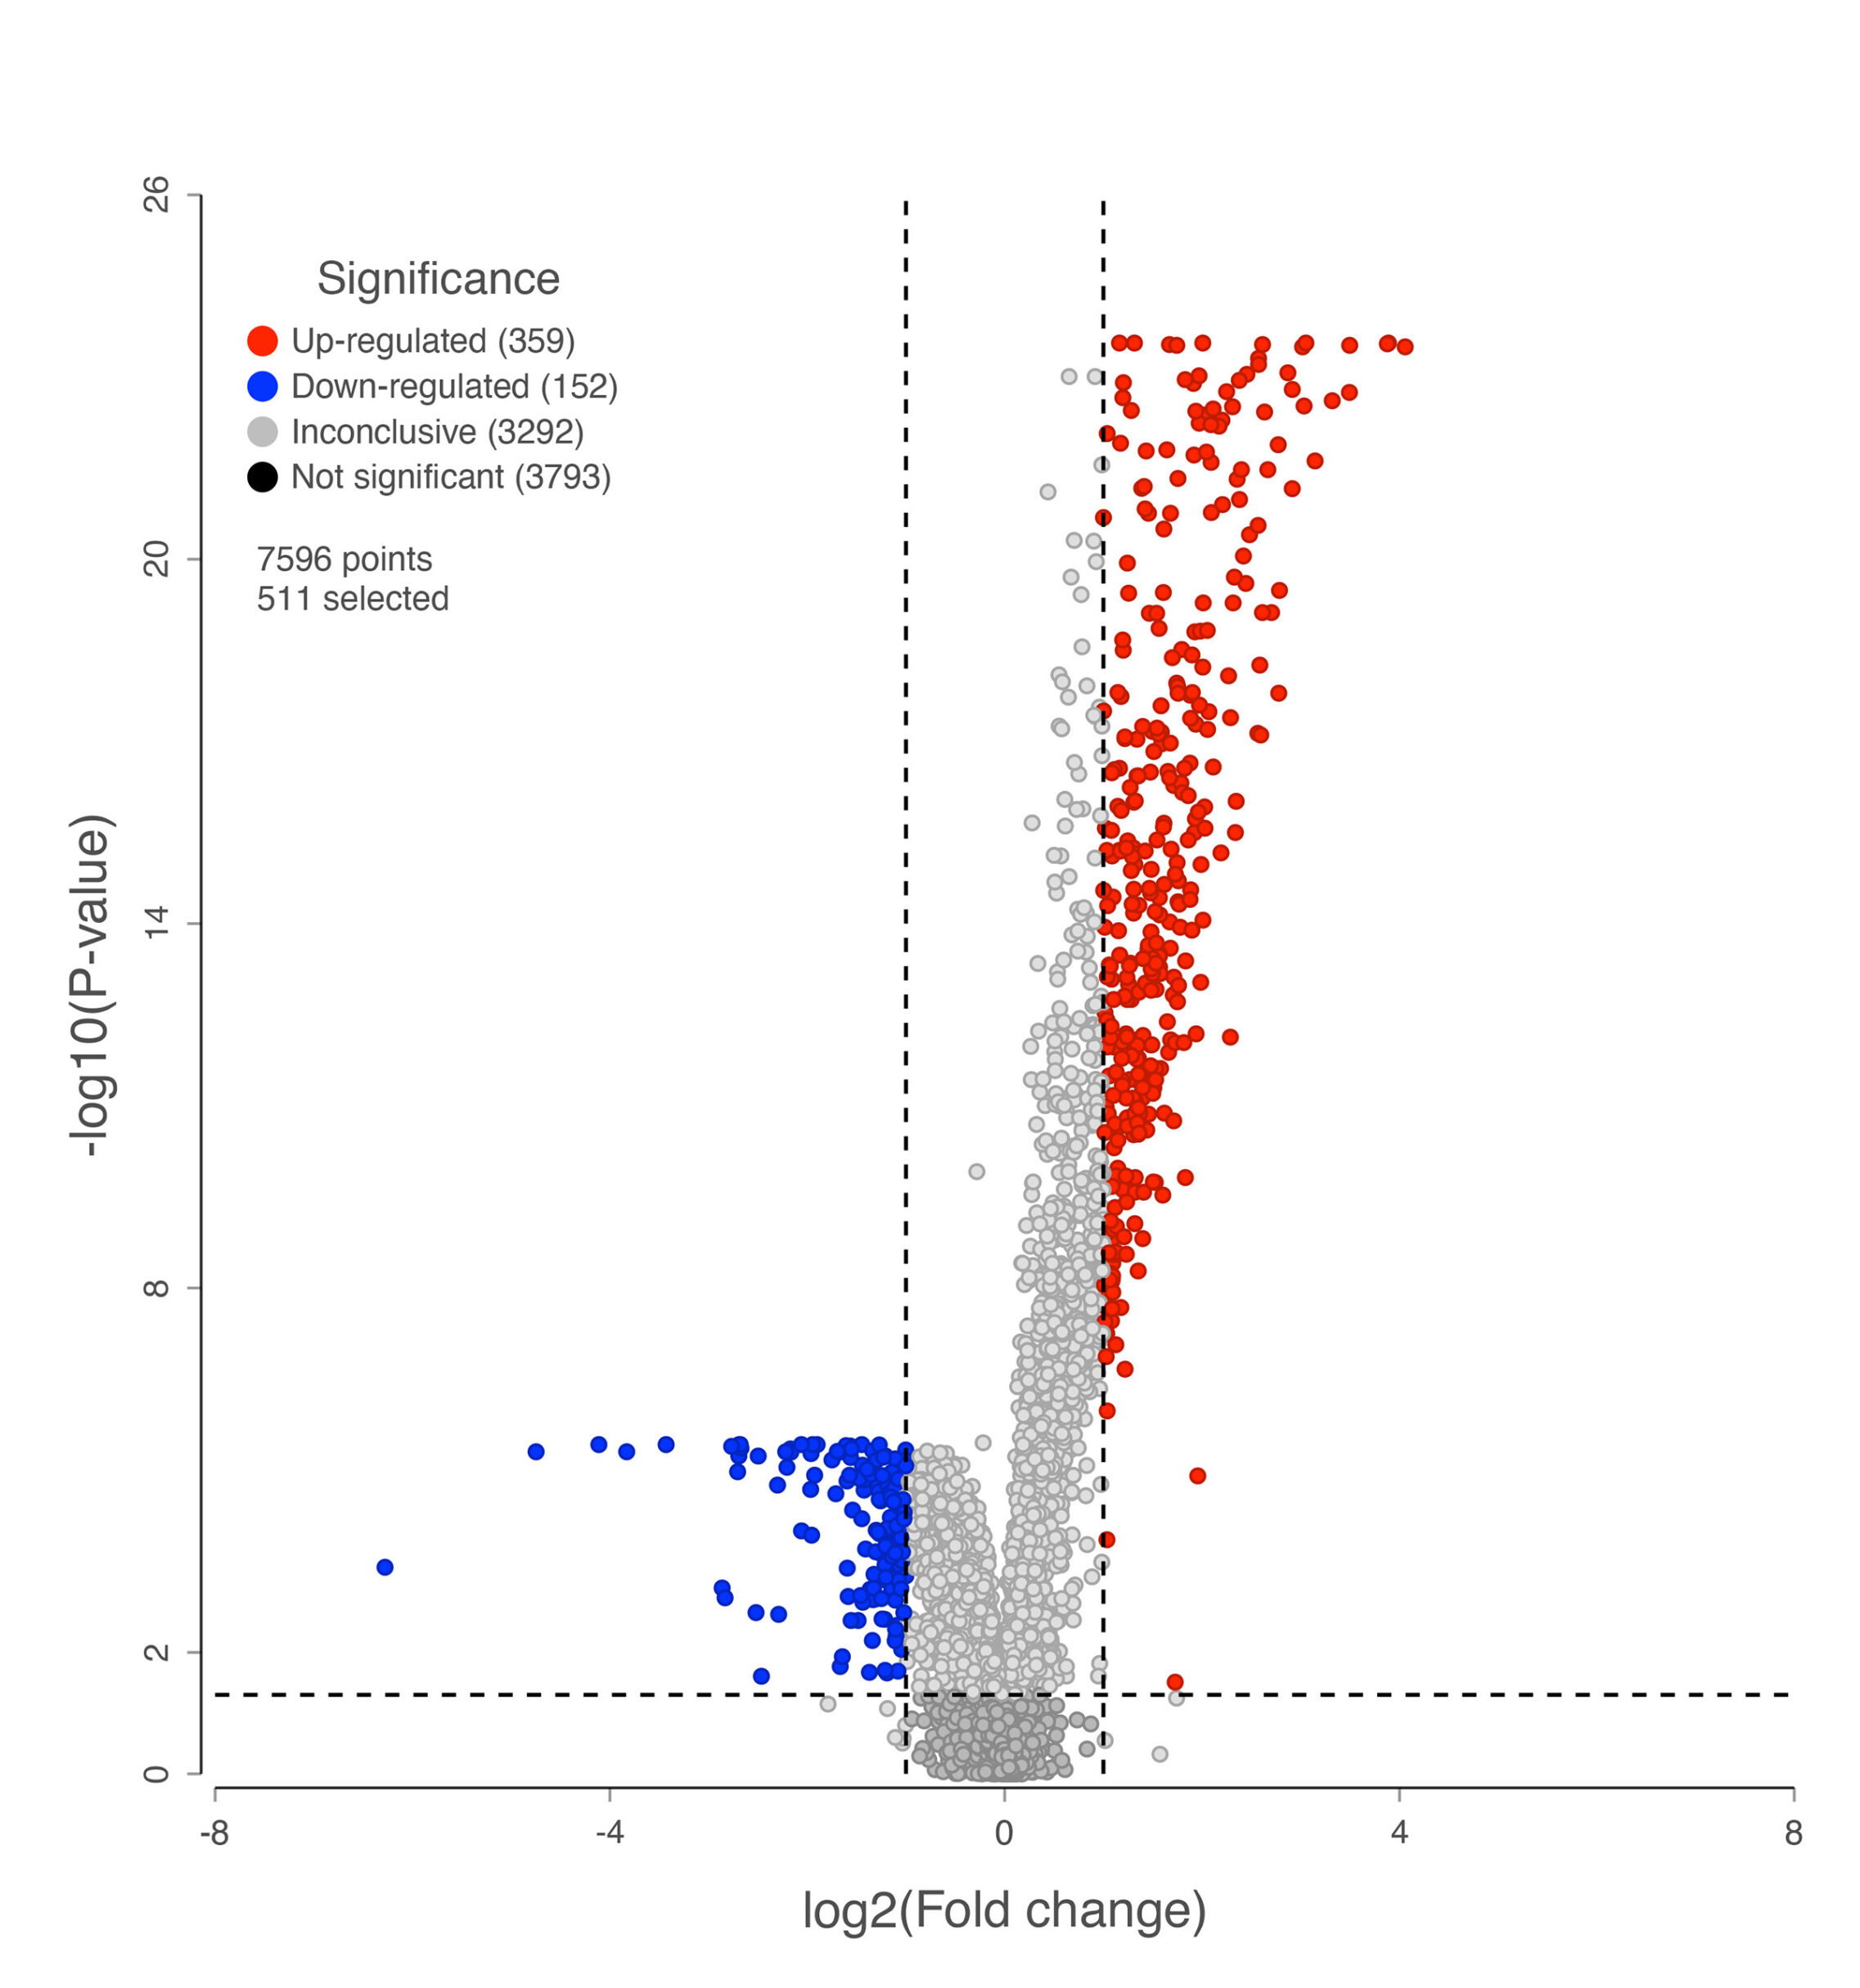 A volcano plot visualizing complex datasets generated by proteomic approaches.
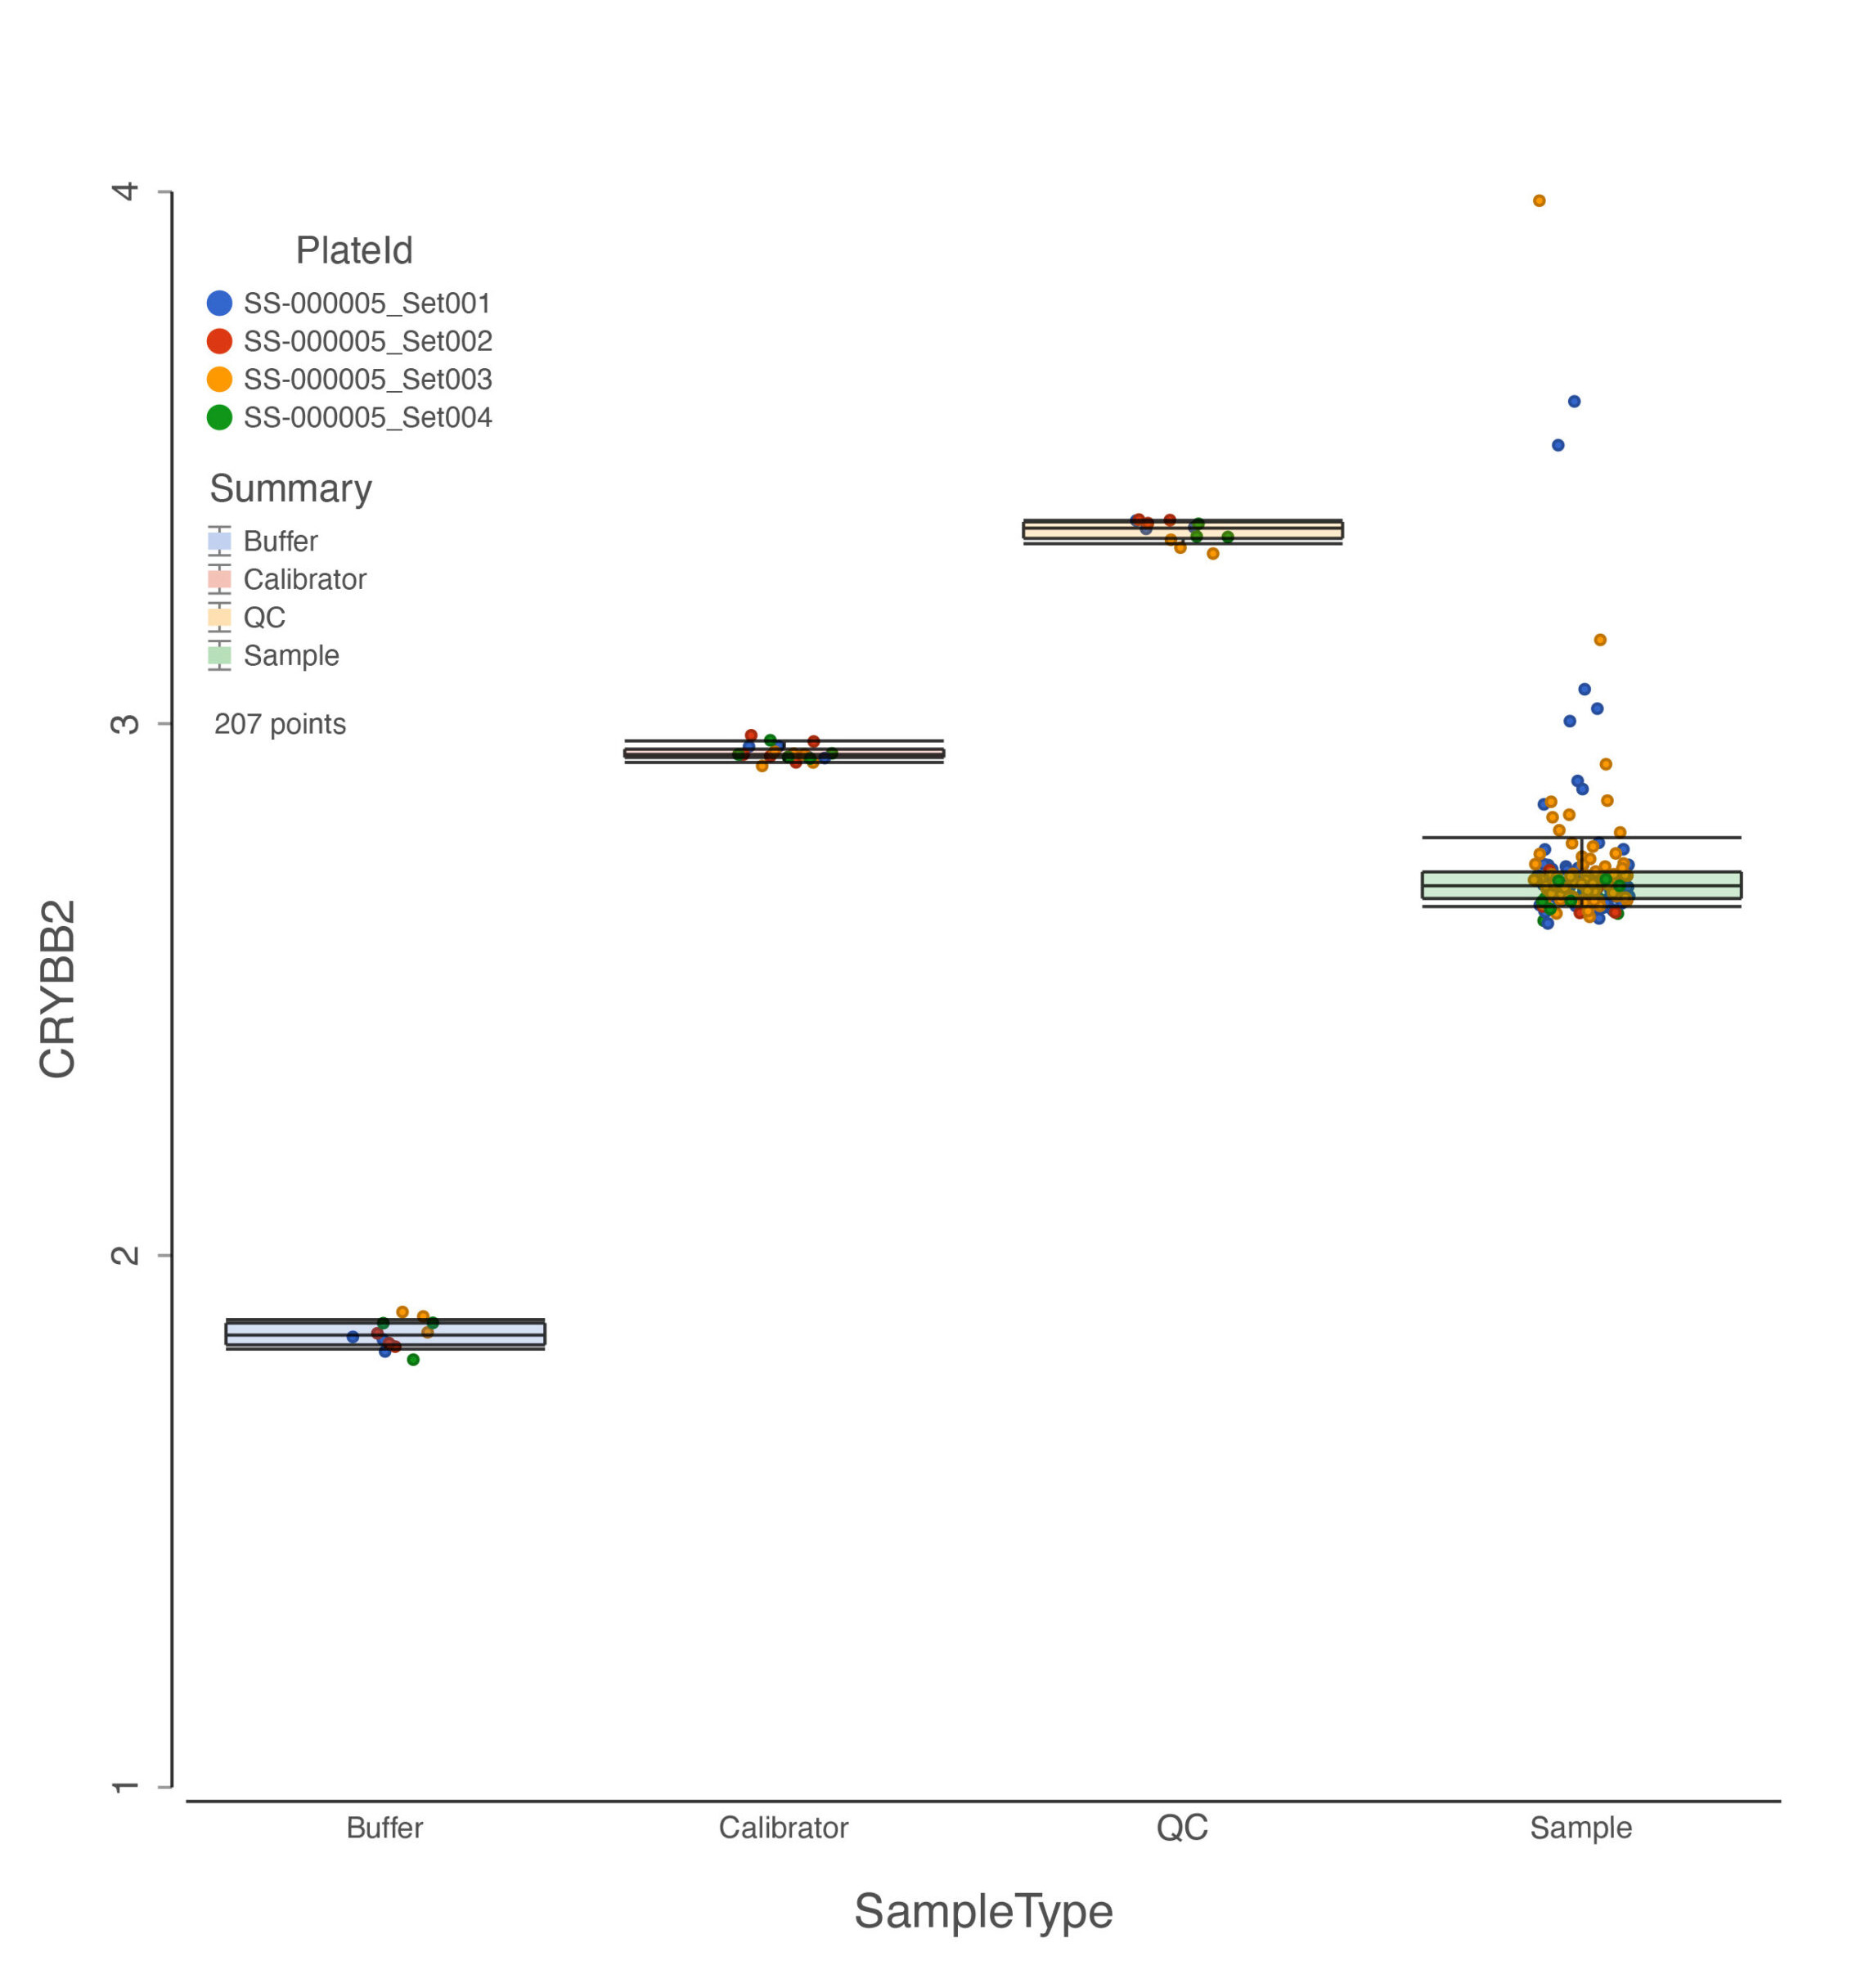 Different sample types of SomaLogic data where each data point is colored by plate ID.
Powerful Tools & Features in an Easy-to-Use Application:
 |
Easy Data Import and Export Import ADAT file for Somalogic data, .txt file for Olink data, or .txt/.fcs files for mass cytometry data. |
 |
Robust QA/QC Tools Evaluate the status of your analysis and optimize downstream viability using a variety of quality assurance/control tools and reports. |
 |
Explore Multiple Samples Simultaneously Analyze and visualize multiple samples together or independently and discover biological variations with combined and split-by-sample analysis. |
 |
Detect Differential Expression Patterns Powerful statistical analysis tools help you determine patterns and markers in datasets. |
 |
Investigate Gene Set and Pathway Enrichment Learn about the biology underlying gene expression changes using gene ontology (GO) or pathway enrichment analysis. |
 |
Interactive Visualization Modify data-rich visualizations with direct manipulation to drill down to the details you need and export in publication-ready formats. |
 |
Define and compare cell populations through biomarker discovery Take advantage of extensive statistical models to make meaningful comparisons using protein markers to define a cell population, condition, or another parameter within your study. |