One of the most exciting technological innovations in recent years is multiomic analysis in single cells. Technologies like CITE-Seq (transcriptomic and proteomic expression data from the same cells) have taken some research fields, such as immuno-oncology and neuroscience, to the next level.
It’s one thing to obtain both data types, and another to know how best to use them. Here are three strategies for integrating transcriptomic and proteomic data, particularly for identifying cell types.
Use only the proteomic data to cluster cells, use protein & gene expression to infer cell types
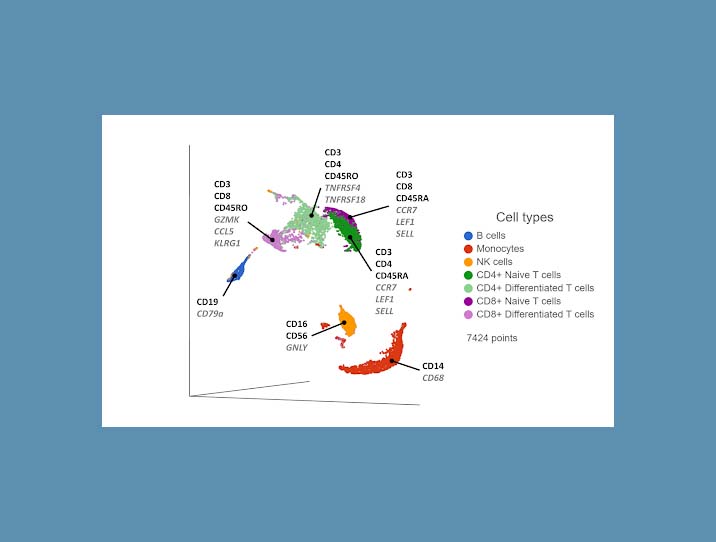
Cell surface proteins offer excellent resolving power in identifying the major cell types, so it makes sense to combine information across multiple protein markers to cluster cells together. You can use the most highly expressed proteins (biomarkers) in each cluster to infer which cell type each cluster corresponds to. If any protein markers are missing from the panel, you can use highly expressed genes as biomarkers to fill in the gaps (Figure 1).
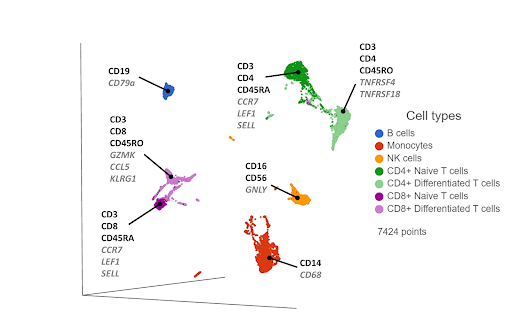
Figure 1. UMAP plot of single cells from a PBMC sample*. Cells are clustered based on 17 protein markers. Clusters are labeled with some diagnostic protein biomarkers (black, bold) and gene biomarkers (grey, italic) for each cell type.
One drawback to this approach is the limited number of protein markers in a panel. Each oligo-conjugated antibody targets a different cell surface protein. A panel of 15-20 antibodies may be enough to distinguish some of the major cell types, which may be fine for some studies. But if cell surface protein markers specific to certain cell types are missing from the panel, those cell types may not be easily distinguished as separate clusters and identified.
Use only the transcriptomic data to cluster cells, use gene & protein expression to infer cell types
Single cell RNA-Sequencing has proven to be effective in clustering single cells based on their transcriptome-wide gene expression profiles. High expression of known, canonical marker genes in each cluster can be used to infer the cell type identity of each cluster. While the proteomic data may be limited by the number of known markers, transcriptomic data has no such limitation, with thousands of genes being quantified per cell in an unbiased manner. The additional gene information and biomarkers also create the possibility of discovering novel, cryptic cell type subsets (Figure 2).
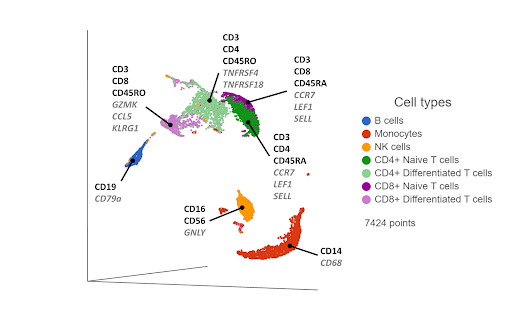
Figure 2. UMAP plot of single cells from a PBMC sample*. Cells are clustered based on 21,002 gene expression markers. Clusters are labelled with some diagnostic protein biomarkers (black, bold) and gene biomarkers (grey, italic) for each cell type.
One drawback of this approach is that cells that are phenotypically distinct at the cell surface protein level are not always distinct at the transcriptomic level. For example, CD4+ and CD8+ T cells are clearly distinguished as separate clusters at the proteomic level (Figure 1), but they are closer together at the transcriptomic level (Figure 2). Furthermore, the T cells cluster primarily by their state (naive & differentiated) in Figure 2, rather than by their phenotype. Layering in the protein biomarkers onto the transcriptome-derived clusters can help resolve these cell types.
Use a Weighted nearest neighbor (WNN) approach to integrate both data sets, cluster the cells, use gene & protein expression to infer cell types.
Both transcriptomic and proteomic data will vary in their information content and quality. WNN is a computational method that blends the best of both data types (Hao, Hao, Andersen-NIssen et al., 2021). It learns the information content of each data type and generates an integrated representation of the joint data.
First, you reduce the dimensionality of each data type using principal component analysis (PCA). The PCA results are fed into the WNN algorithm, which generates a WNN graph. For each cell, the graph lists the most similar cells (nearest neighbors) and their distances, where the distances are weighted on cell-specific information content from each data type. Some cells might have more information from the transcriptomic data, and others from the proteomic data. The WNN graph can then be used as input for clustering and visualization (Figure 3).
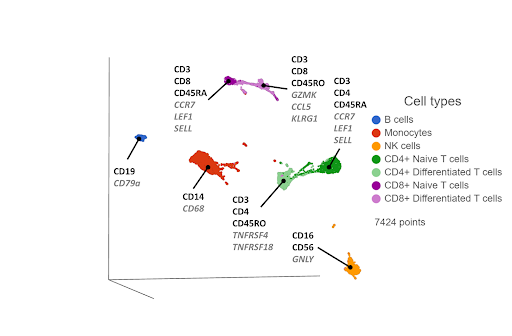
Figure 3. UMAP plot of single cells from a PBMC sample*, following WNN integration of transcriptomic and proteomic data. Clusters are labeled with some diagnostic protein biomarkers (black, bold) and gene biomarkers (grey, italic) for each cell type.
In some of our own internal testing, we’ve seen WNN work best when the two data sets have complimentary information. For example, let’s say the transcriptomic data correctly separates hypothetical cell types A and B, but cell types C and D form a single cluster. The proteomic data would be complimentary if it separates cell types C and D, but not A and B. WNN would then do a good job of combining the best of both worlds, separating A, B, C, and D.
Summary
There have been some very exciting technological innovations in single cell multiomics in the last few years. It seems that there are multiple ways in which you can combine transcriptomic and proteomic data, not limited to the three strategies outlined above. My recommendation would be to try a few different methods and see what works best for your data and research question.*The PBMC data used to generate the plots were from a healthy donor and downloaded from 10x Genomics’ website. The cells are screened with 10x Genomics’ Feature barcoding assay, with TotalSeq™-B antibodies targeting 17 cell surface proteins. All analyses were performed in Partek Flow v10. The filtered UMI count data were quality-filtered and normalized. PCA was used for dimensionality reduction. WNN was used for integration across the two data types. UMAP was used for clustering and visualization.
Other Blog Posts
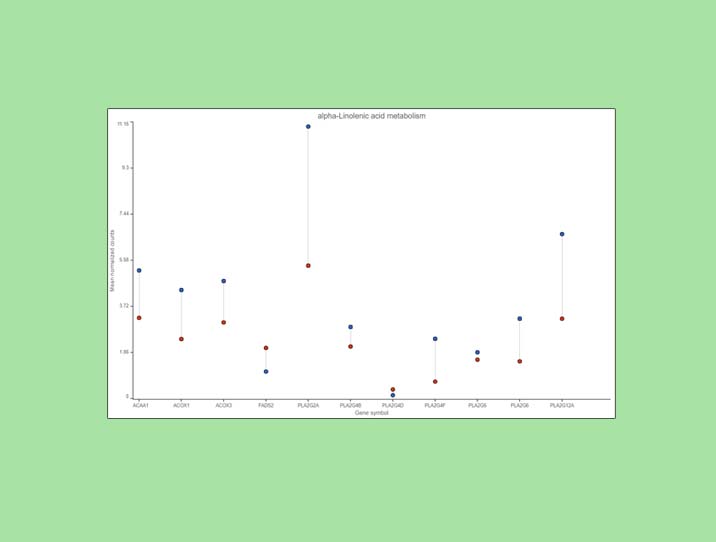
Pathway Analysis: ANOVA vs. Enrichment Analysis
Comparing gene expression levels across samples
Partek and Agilent Deliver Alissa Customers End-to-End Bioinformatics Workflow
Robust, flexible, and customizable workflow to meet Agilent customer demands.
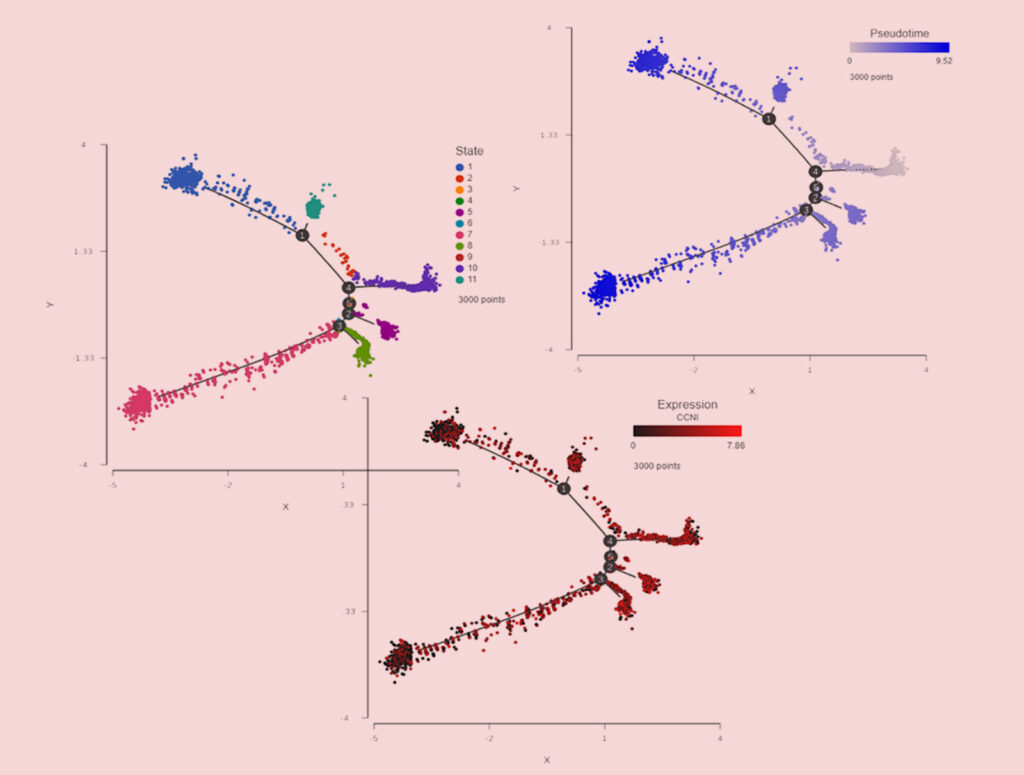
Cellular Differentiation Using Trajectory Analysis & Single Cell RNA-Seq Data
What the ancient Greek Moirai have to do with single cell RNA-Seq trajectory analysis?