One of the main steps in nearly every bulk RNA-Seq or single cell RNA-Seq project is some sort of statistical testing to compare gene expression levels across samples. After which a list of significant genes is generated by applying a filter strategy, the most common being fold change > |2| and false discovery rate (FDR) < 0.05 (the exact values depend on the research question).
There are different ways to interpret the resulting list of significant genes. The most straightforward is to perform enrichment analysis, which identifies gene sets (e.g., pathways or gene ontology categories) that are overrepresented in the list of the significant genes. Then a 2 ✕ 2 contingency table is created for each gene set: the number of genes present in the list of significant genes and in the gene set and the number of genes present in the list of significant genes but not in the gene set, etc. A statistical test (like Fisher’s exact test) can be invoked on the contingency table. Most researchers transform the p-value into an enrichment score (enrichment score = -ln(p-value)) to make it easier to read (e.g., 6.9, instead of 0.001). Let’s have a look at a simple hypothetical example; a list of significant genes consists of 291 genes. Of those genes, 35 (12%) belong to a particular gene set. The set itself consists of 80 genes and almost half (35/80) are present in the list of significant genes (Table 1). Based on the contingency table, Fisher’s exact test statistic p-value is 8.28×10⁻²⁴. Converted to the enrichment score, the value is 53.15. In other words, the number of genes in gene sets that are also in the list of the significant genes exceeds the expectation.
| Genes in list | Genes not in list | Total | |
|---|---|---|---|
| Genes in set | 35 | 45 | 80 |
| Genes not in set | 256 | 4,929 | 5,185 |
| Total | 291 | 4,974 | 5,265 |
To illustrate biological interpretation, we used a spatial transcriptomics data set, consisting of two human prostate samples: a cancer sample and a normal sample harvested from another individual. The samples were processed by the 10x Genomics Visium platform and are available here. Using the graph-based clustering approach, tissue spots were classified as cancer or normal. Differential expression testing was performed and a list of significant genes was created using fold change > |2| with a false discovery rate (FDR) < 0.05. The list was then interpreted by pathway enrichment with KEGG pathways as the pathways database.
Figure 1 shows the top ten enriched pathways. The first pathway really stands out as a “focal adhesion”. Two additional pathways relate to the adhesion of cells to either other cells or components of the extracellular matrix; dysregulation of genes involved in adhesion is a well-known feature of prostate cancer (particularly important for metastases).
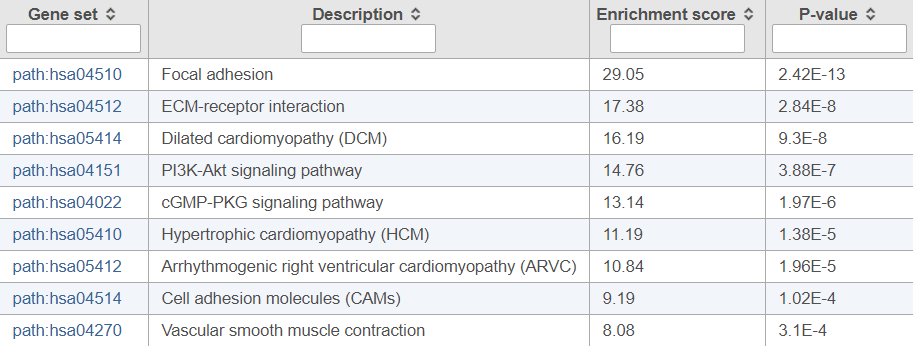
Figure 1. Pathway enrichment results invoked on a list of differentially expressed genes between normal human prostate tissue and cancer tissue (top ten pathways are shown)
Although the enrichment results make sense, they fail to reveal all the biological nuances. It is important to note that enrichment focuses on genes that show considerable differences in expression level between the conditions, while the genes with subtle changes simply go unnoticed. But what if within a pathway several genes are slightly up-regulated to the baseline condition? For instance, in a signaling pathway, even slight changes in expression levels may have profound biological consequences.
One way to address the limitation of enrichment is to use a strategy that could be described as “differential set expression”. For any gene set (e.g., a pathway) expression values of all the genes within the set are added up and then those sums are compared between the samples (basically, pathway ANOVA). This is the principle behind Pathway Analysis as implemented in Partek™ Flow™ (Figure 2).
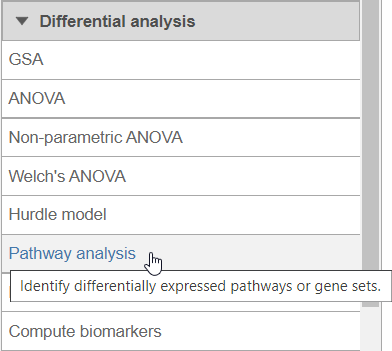
Figure 2. Differential Analysis section of the toolbox in Partek Flow, showing the Pathway Analysis tool.
Using the same project to illustrate the concept, cancer and normal samples were compared using Pathway Analysis. The resulting pathways are sorted by fold change (descending) and the top ten pathways are shown in Figure 3.
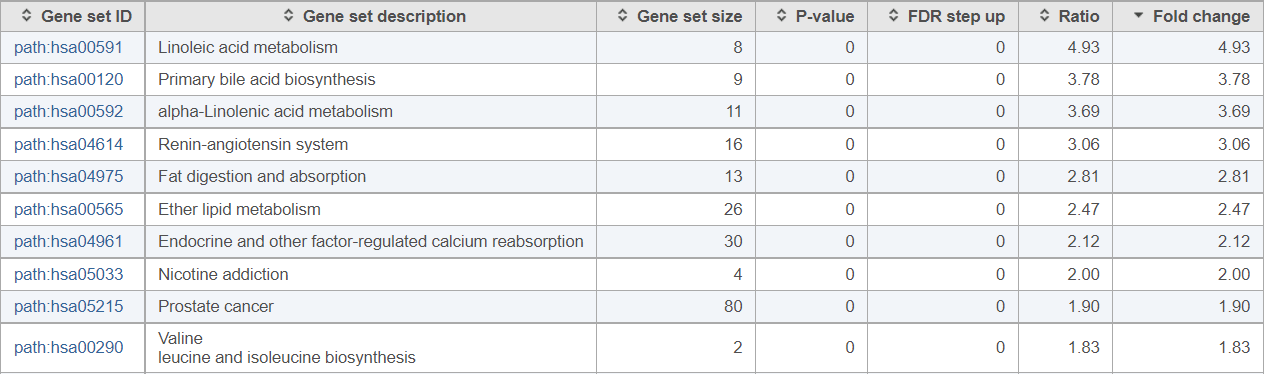
Figure 3. Pathway analysis results obtained by comparing a normal human prostate and cancer tissues (results sorted by descending fold change, top ten pathways are shown)
If you are not familiar with the biology of prostate cancer, these results may be unexpected: half of the pathways with the highest fold change values relate to lipid metabolism. It turns out, dysregulation of lipid metabolism is one of the hallmarks of prostate cancer (e.g., Poulose et al., Nat Gen 2018).
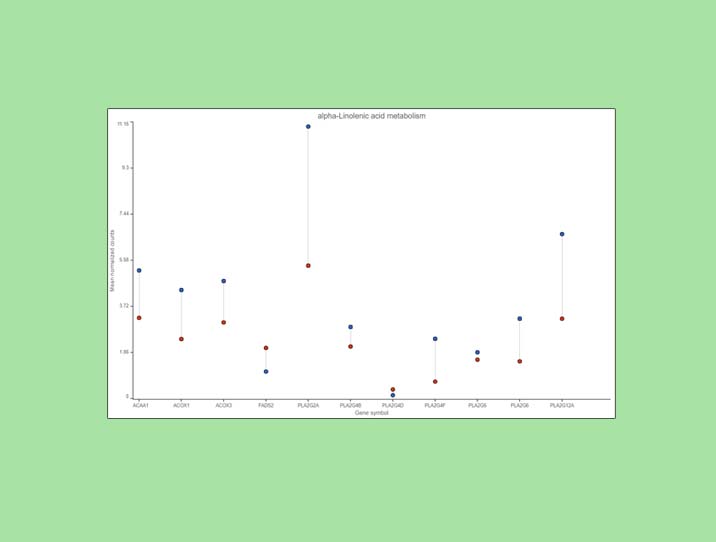
Examination of one of the pathways (ɑ-linolenic acid metabolism, Figure 4) sheds light on the difference between pathway analysis and pathway enrichment. All the genes in the pathway are indeed expressed at a higher level in the cancer samples (blue), but the difference in terms of fold change (per gene) is modest, at best, and below the usual cut-off value of 2. Hence, it is not surprising that the enrichment score value for the ɑ-linolenic acid metabolism pathway is 1.34 (corresponding to Fisher’s exact test p-value of 0.26).
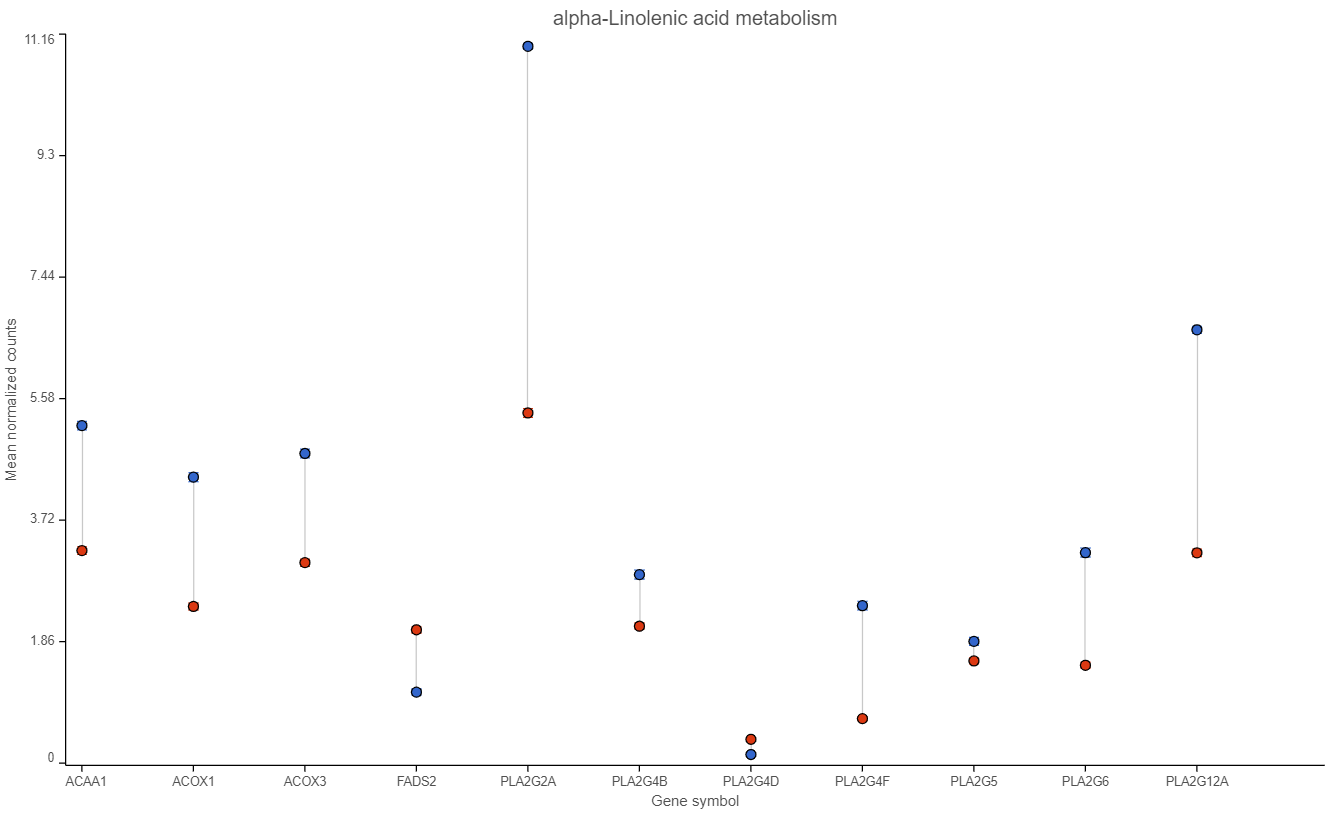
Figure 4. Expression levels of genes in the ɑ-linolenic acid metabolism pathway in the cancer (blue dots) and normal sample (red dots).
In summary, enrichment is a valid and valuable approach to contextualize gene lists (sometimes it is the only available method, e.g., if a gene list is obtained from a publication), but it has limitations. In the current example, pathway enrichment yielded valuable results, but additional biological insight was obtained when applying pathway ANOVA. We encourage you to try it with your next experiment and share your experience with us.