Single Cell and Bulk Multiomics
Multiomics allows scientists to analyze and combine multiple types of molecular information within individual cells to gain a deeper and more comprehensive understanding of cellular behavior and function. Partek™ Flow™ software makes the challenges of multiomics data analysis easy with a user-friendly interface, advanced statistical algorithms, and rich interactive visualizations for start‑to‑finish multiomics analyses.
Powerful Multiomic Tools & Features in an Easy-to-Use Application:
 |
Integration Separate and combine various modalities to uncover hidden relationships. |
 |
Data Quality Use appropriate quality control and analysis options for data types to produce relevant results. |
 |
Normalize Data and Correct Batch Effects Make your data comparable and reliable for integration using Partek®Flow® tools. |
 |
Correlation Assess relationships between different omics layers. |
 |
Feature Linkage Reveal complexities between gene expression and accessible genomic regions. |
| Dimension Reduction and Clustering Retain relevant information for each omic layer then merge matrices to explore both individual and combined data. |
|
 |
Statistical Visualization with Rich, Interactive Plots Use statistics and interactive plots simultaneously with multiple data types to explore and simplify interpreting multiomic data complexities. |
 |
Iterative Explore multiomic data in many ways by easily refining the approach with a few simple clicks. |
 |
Automatically Document Your Analysis Analysis steps, parameters, and commands are automatically documented for reproducibility, transparency, and reporting. |
 |
Collaborate Let your team work together from anywhere using our flexible platform which can handle the scale of this type of data. |
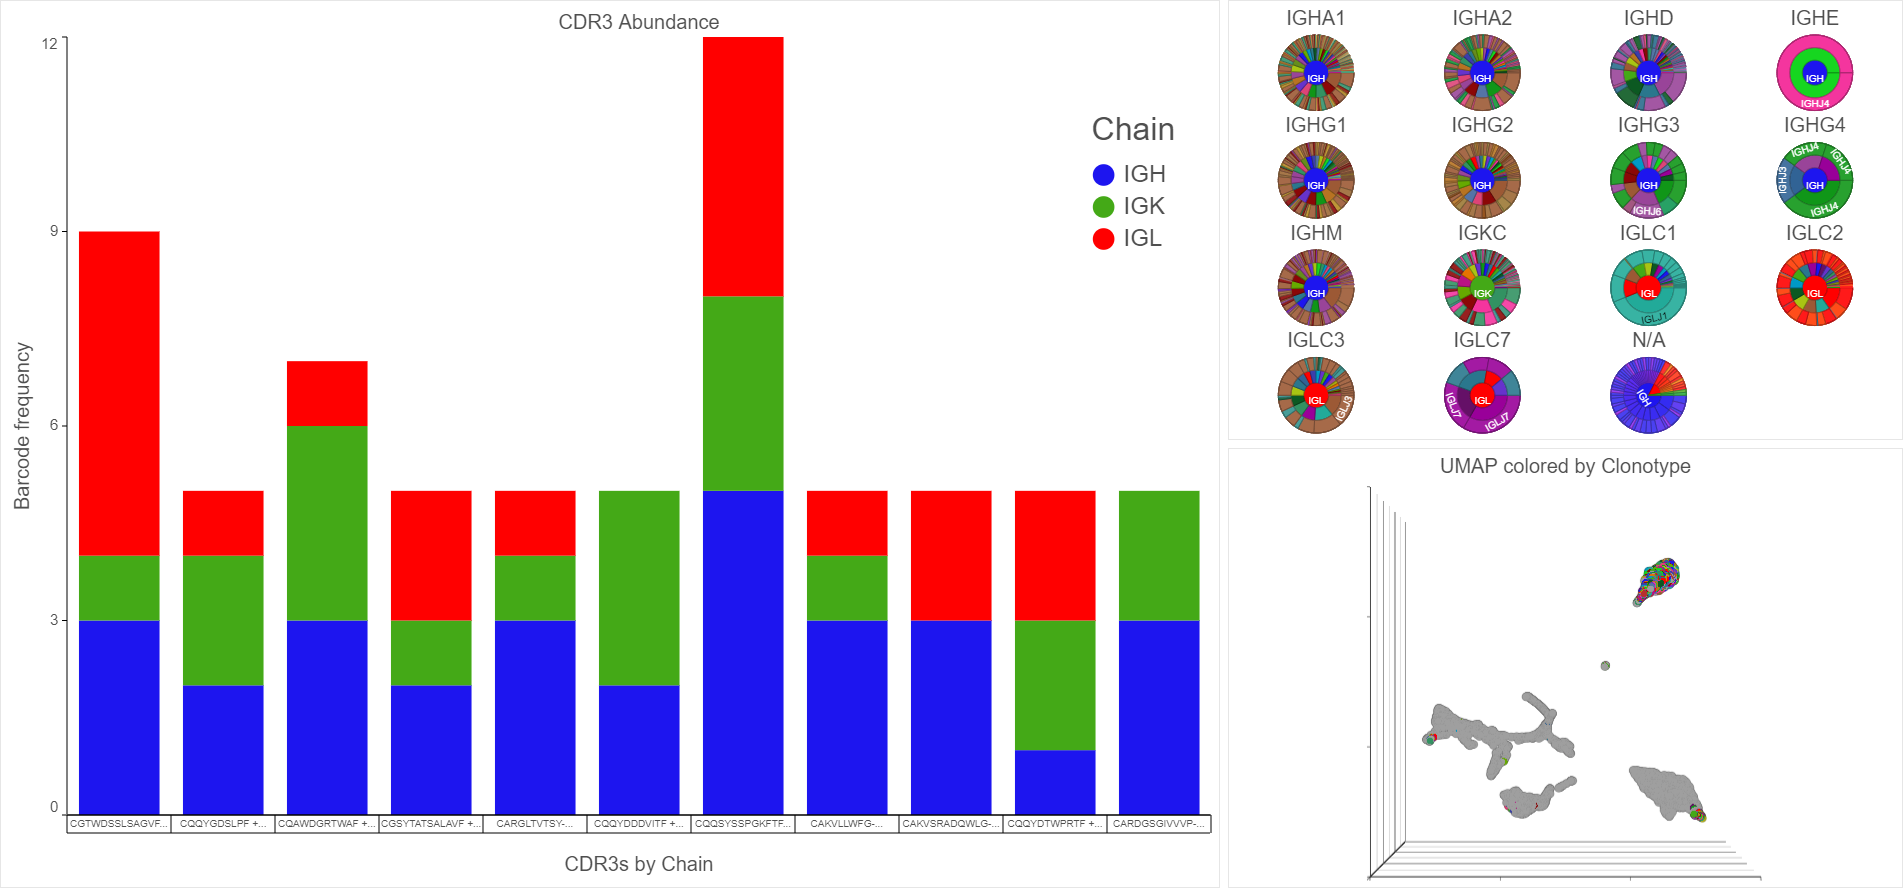
Explore Different Types of Data Together Including RNA-Seq and V(D)J Immune Profiling
Add as many visualizations to the data viewer session as desired.
Detect V(D)J variation to determine the makeup of clonotypes and use bar charts and pie charts to visualize frequency and clonal diversity. By integrating the clonotypes and gene expression data, you can overlay V(D)J data with gene expression data plots.
Analyze RNA-Seq and ATAC-Seq/ChIP-Seq Multiomic Data
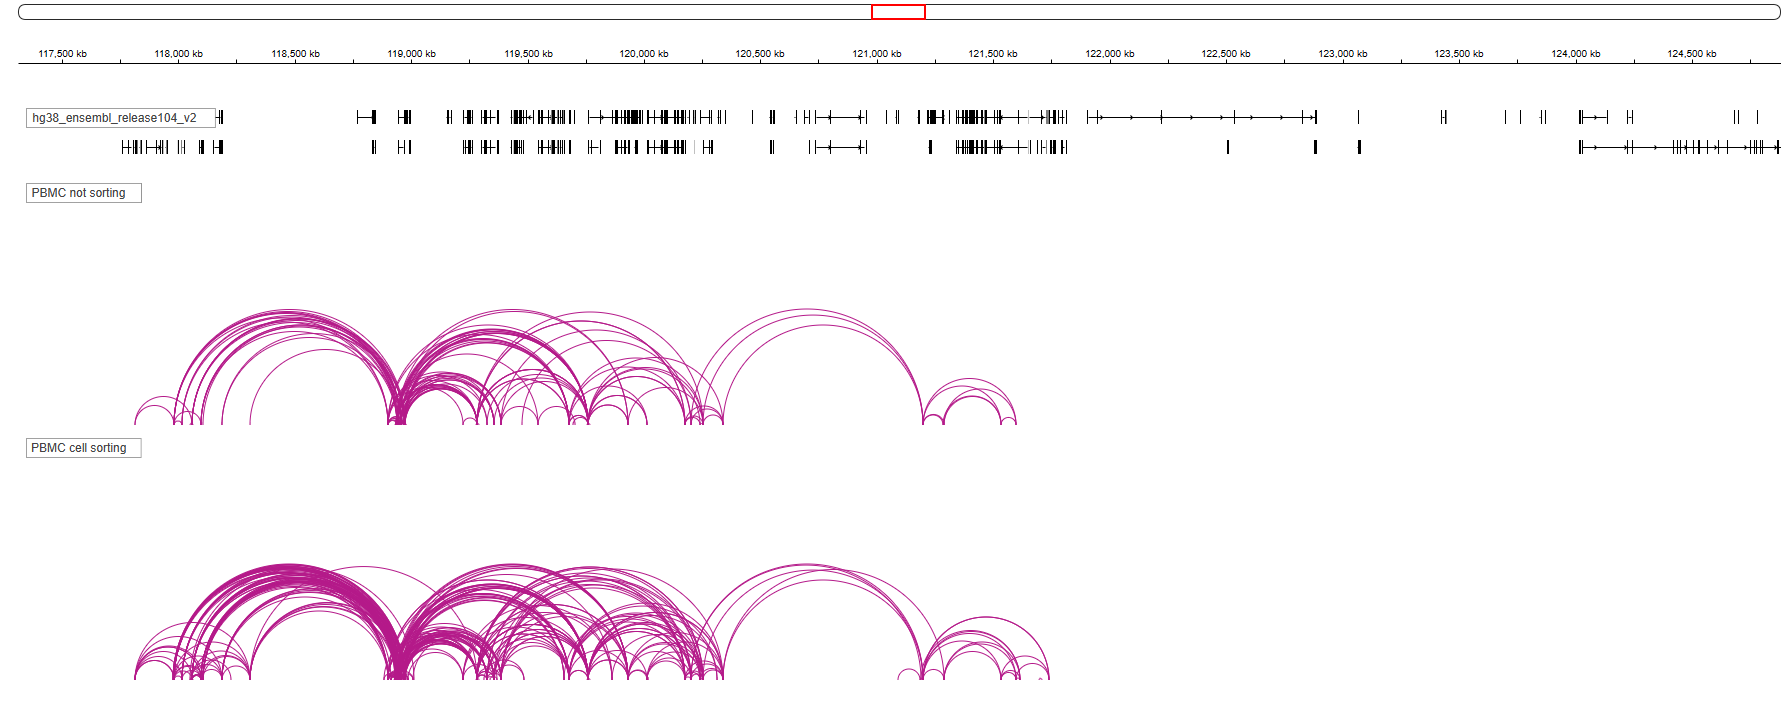
Analyze the multiomic layers of your data to unravel complexity.
Take advantage of both modalities to gain insights into the regulatory landscape. Here we are showing feature linkage results to further understand the complexities of the regulatory landscape using both gene expression and accessible genomic regions.
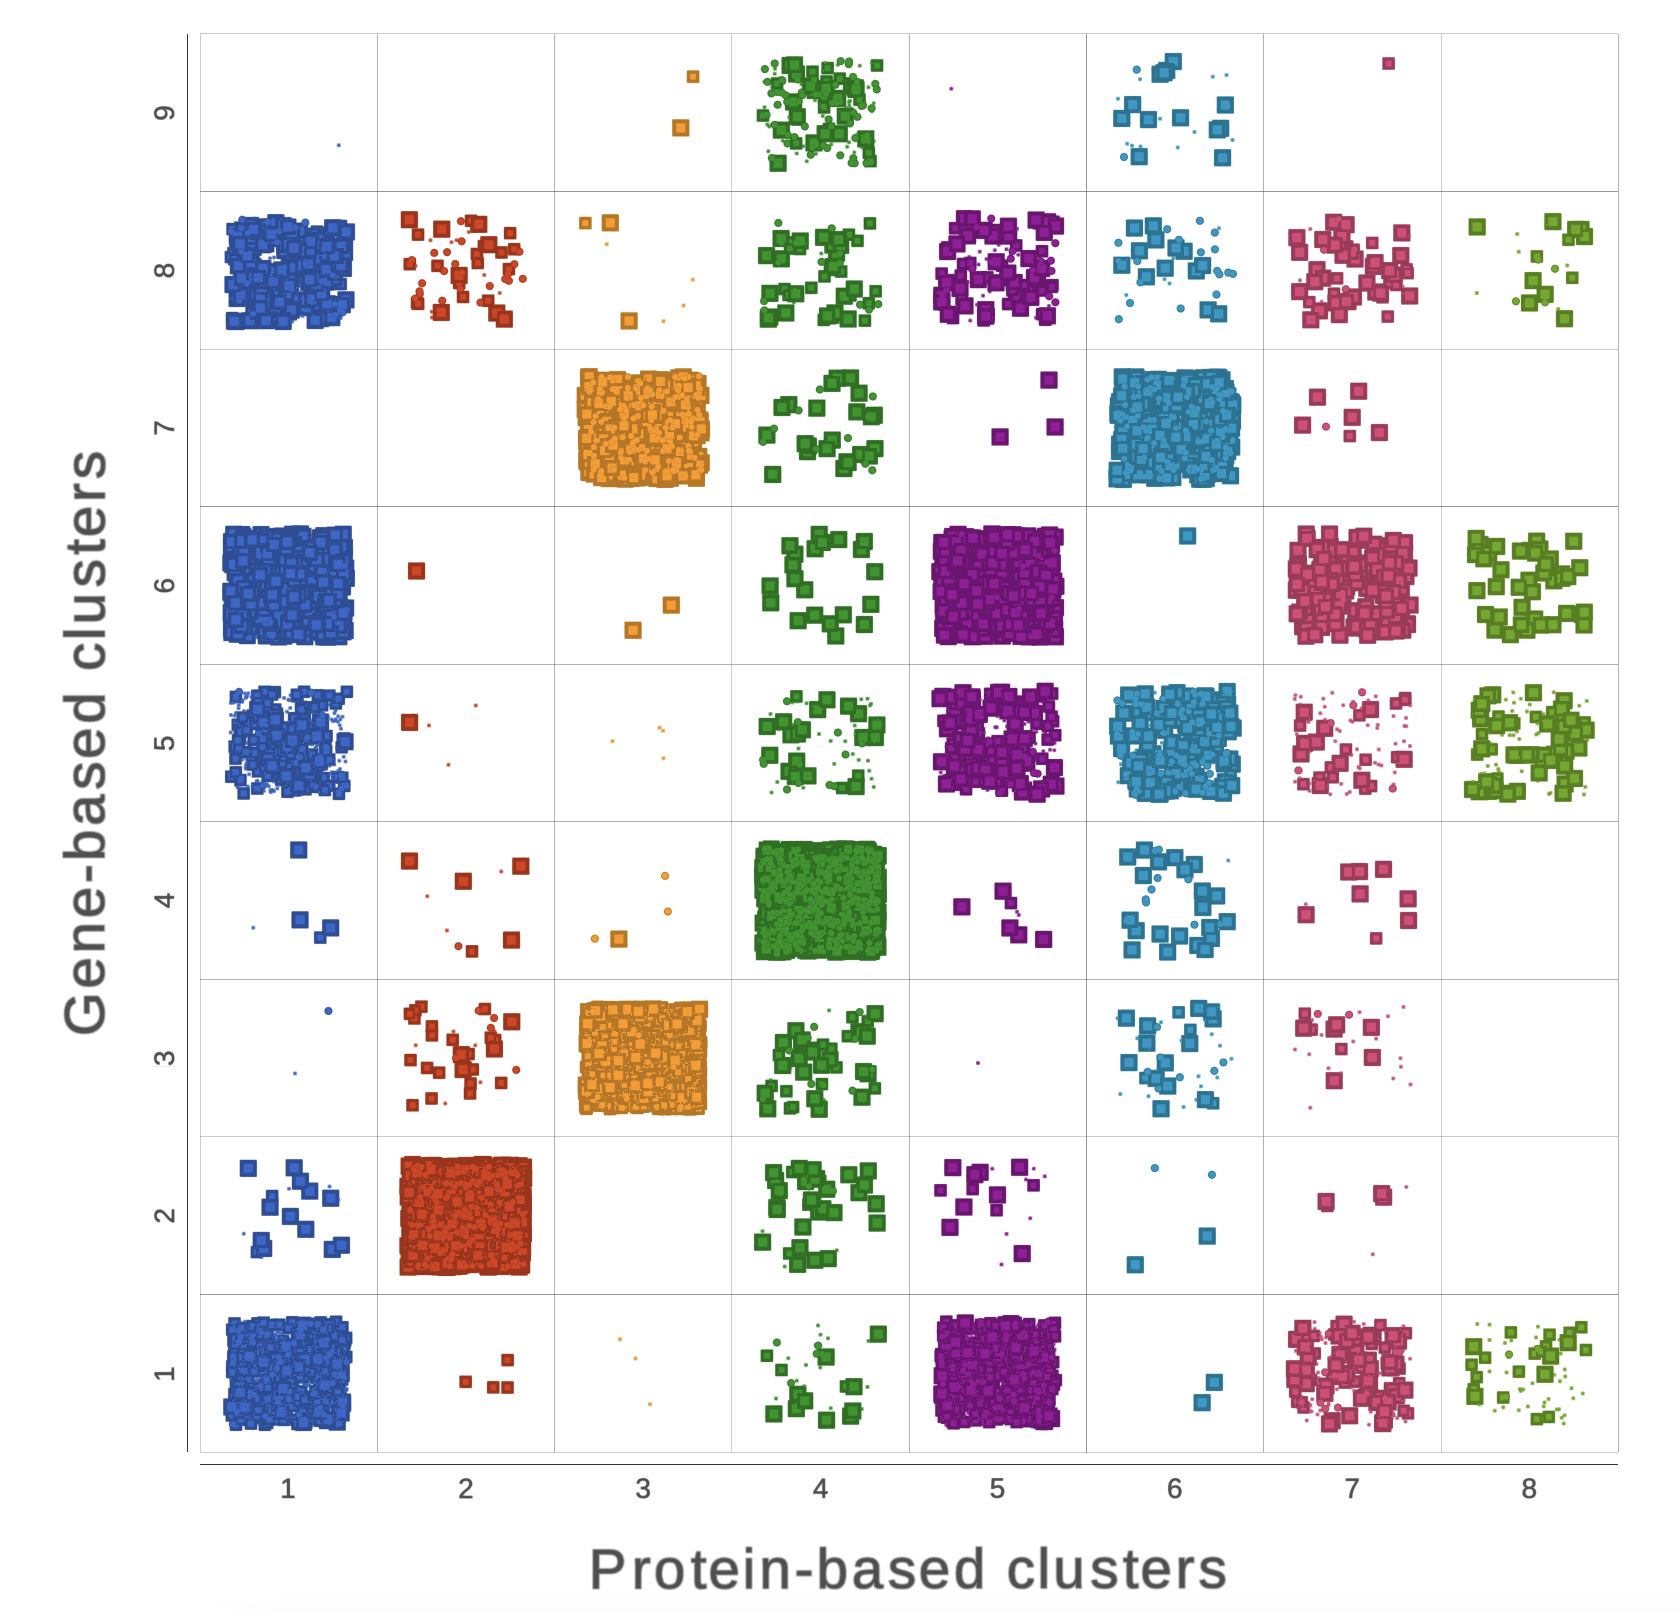
Explore RNA-Seq and Protein Expression Multiomic Data.
Easily compare the different types of data.
See the intricate similarities and differences between clustering methods through comparison with a chi-square plot. In this manner, you can assess associations between variables like the example here between gene-based and protein-based clusters. The style options like, color, size, and shape add another level to visualize the extent of differences in your study.
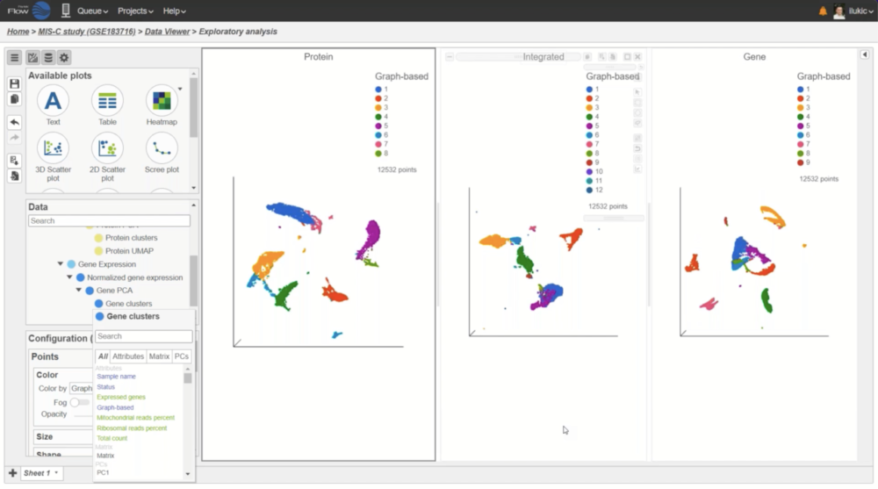
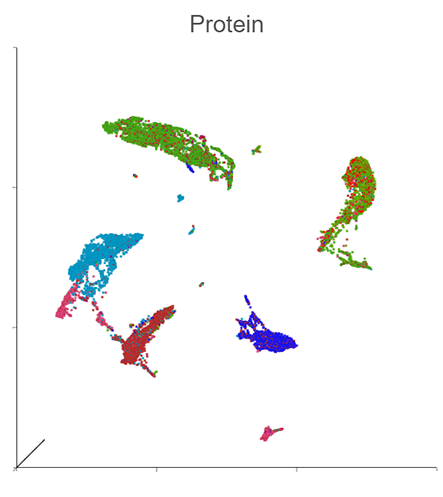
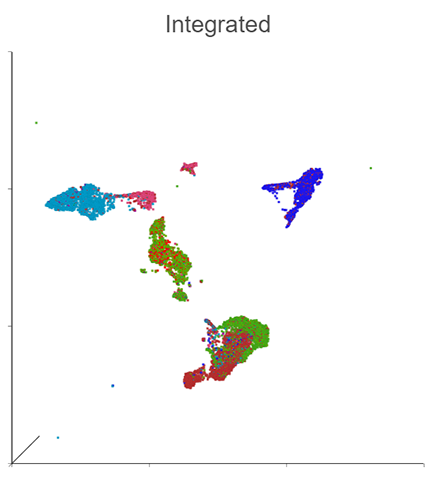
Generate a Holistic View of Cell Behavior with Integrated RNA and CITE-Seq Multiomic Data
Explore data types individually and together to generate insights.
Simultaneously profile both transcriptomic and proteomic data for a dual view of cell states which offers insights into correlations and discrepancies between modalities. This UMAP was generated using the individual protein and gene states as well as the integrated state, to provide a holistic visual of cell clustering via modality changes.

Use Multiple Modalities Together Including Spatial with Histology Data
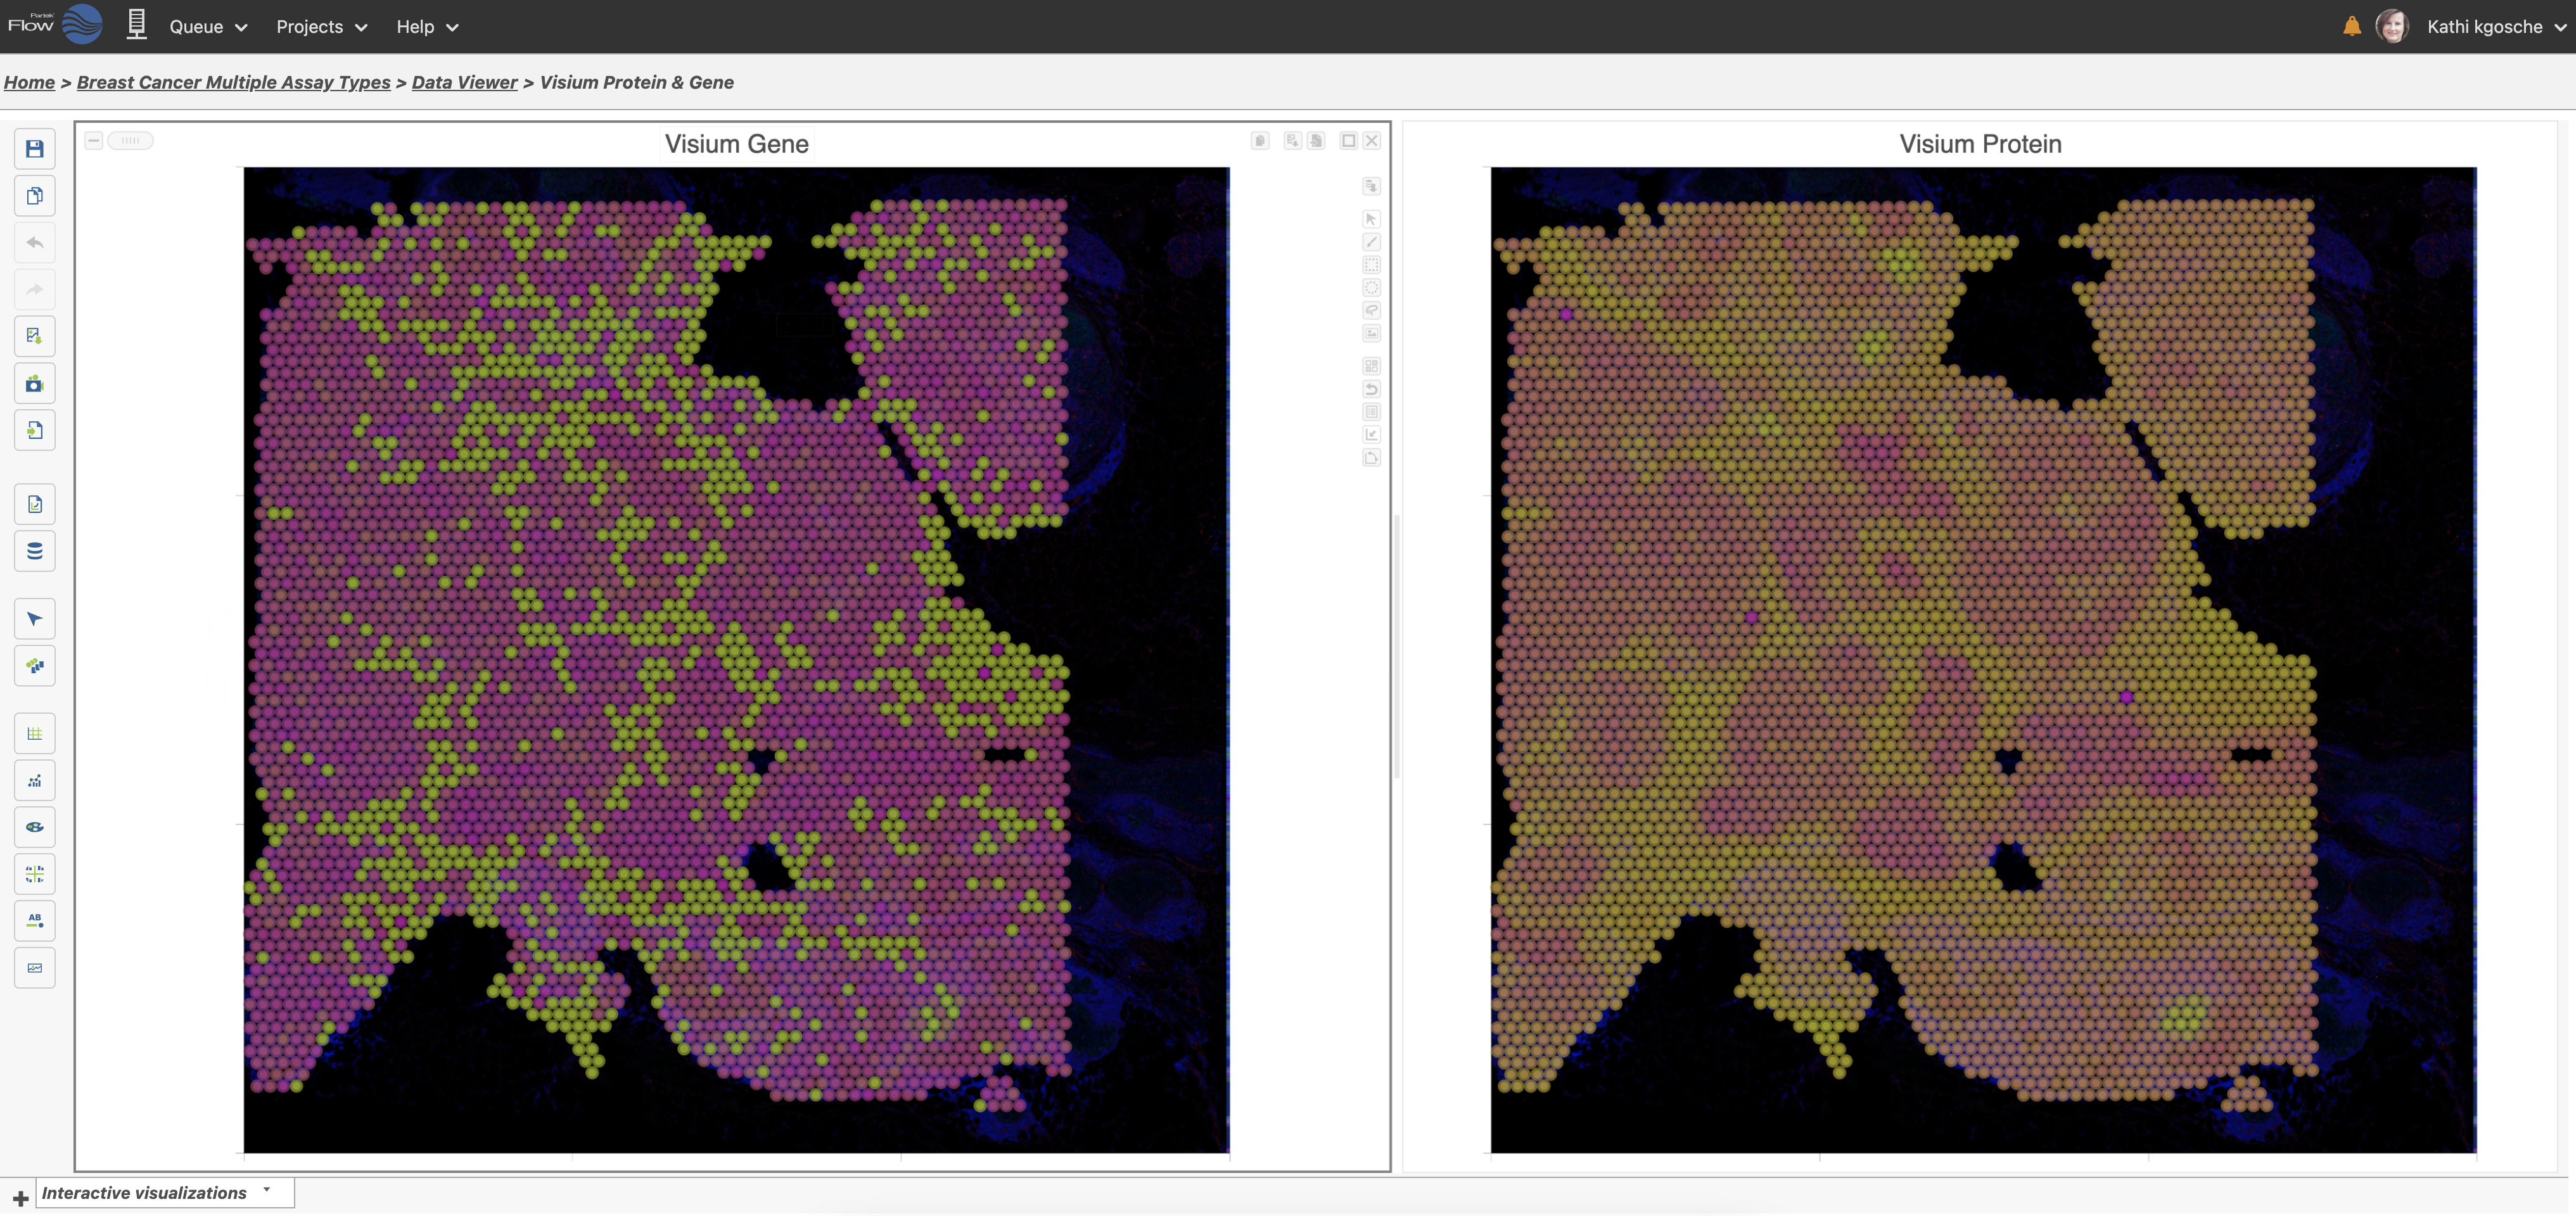
Use different multiomic layers to express research findings.
10x Genomics® Visium® spatial transcriptomics data of both gene and protein colored by BCL2 expression. This integrated approach, with gene and protein expression in the spatial context, provides a wealth of information with one experiment and can be viewed and explored together in the Partek Flow data viewer.