For a few years now, molecular biology has been completely dominated by single cell technologies. It all started with single cell RNA-Seq, but rapidly branched out to other applications, such as epigenomics, regulation (ATAC-Seq and ChIP-Seq), and proteomics (for a high-level overview, we suggest an excellent recent article in Nature Reviews Genetics).
Analysis of single cell data sets may seem complex and confusing at first (for instance, there is still no consensus in the community), but with the right tool, it can be both easy and straightforward. Expanding on the success of previous builds of Partek Flow, we just rolled out version 8.0, paying special attention to single cell omics.
So, what is new? All Partek Flow users love our implementation of the t-SNE plot and now it can be used for visualization of multimodal single cell experiments, such as simultaneous analysis of protein and mRNA expression (underlying technologies are known as CITE-Seq or REAP-Seq). The left panel of Figure 1 shows expression levels of CD3ε mRNA (green) and the matching protein CD3 (red) on peripheral blood mononuclear cells. Many cells are yellowish, indicating coordinated expression of both markers on T cells. A different situation is depicted on the left, where cells expressing the CD11c protein (such as monocytes) seem to be negative for the respective mRNA, which is ITGAX (red and green, respectively).
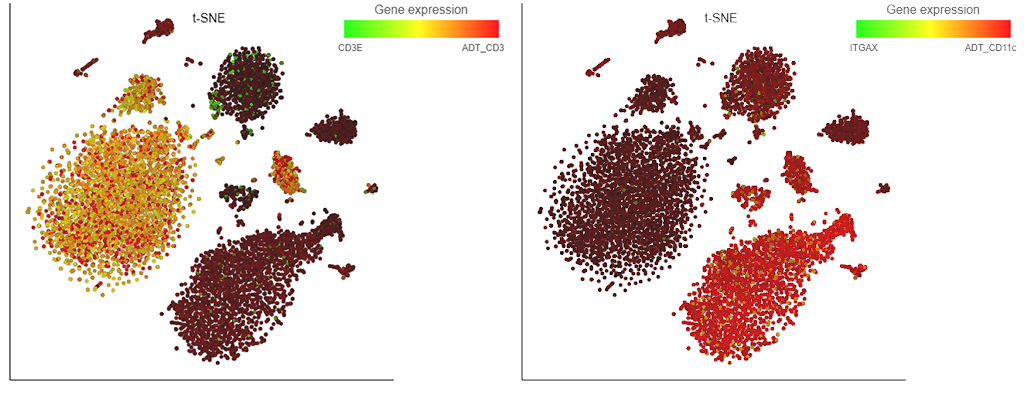
Figure 1. Single cell analysis of mRNA and protein expression on peripheral blood mononuclear cells. Each dot is a single cell, while colors indicate expression levels of mRNA (CD3ε or ITGAX) and protein (CD3 and CD11c). Based on the data from the original CITE-seq publication.
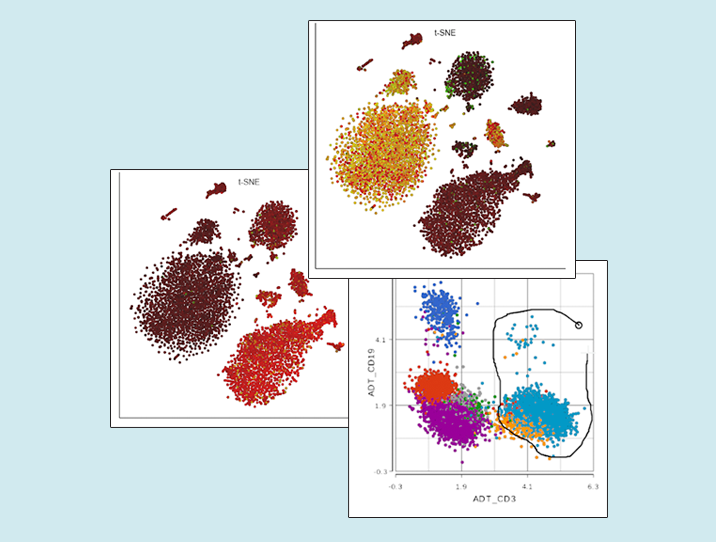
Next, you can now directly pick clusters of cells on the scatterplot, by either using the lasso or setting cut-offs (the term used in flow cytometry is gating; Figure 2).
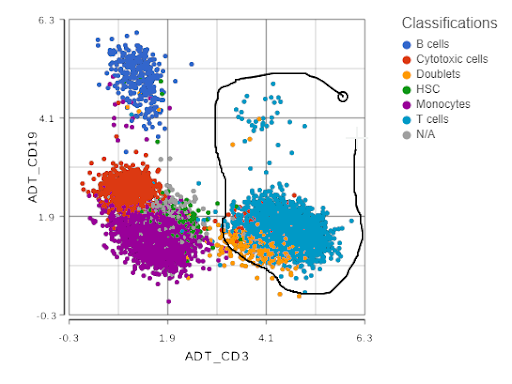
Figure 2. Single cell analysis of protein expression on peripheral blood mononuclear cells. Each dot is a single cell, the axes show expression levels of CD19 and CD3 proteins. Lasso tool is used to gate CD3-positive cells (T cells). Based on the data from the original CITE-Seq publication.
Moreover, we did not forget our users working on other applications. For instance, two variant callers have been added to Partek Flow: GATK HaplotypeCaller and Mutect2. As for RNA-Seq, the set of tools now includes HISAT2 (a splice-aware aligner) and HTSeq-count (a quantification algorithm). The MACS2 dialog has been completely overhauled to support multiple .bam files per sample and to support ATAC-Seq experiments. On a related topic, you can now perform quantitative analysis of your ChIP-Seq/ATAC-Seq experiments in Partek Flow, i.e., use our powerful statistics to compare signal strengths across experimental conditions.
Of course, this is not an exhaustive list, so if you want to know more about the new features of Partek Flow 8.0 and how to use them to get answers to your research questions, please join us for our upcoming webinars. To receive future webinar invitations, fill out the form on this page.