If you follow the field of single cell biology, then you know about the recent trend of simultaneous measurement of both gene expression and protein expression. Here’s an application example based on immunotherapy of mucosa-associated lymphoid tissue (MALT) lymphoma cancer. The most common site is the stomach, but any mucous membrane can be affected.
The cancerous cells of MALT lymphoma are the B lymphocytes, originating from the marginal zone of the MALT, and hence the synonym: extranodal marginal zone B cell lymphoma. In addition to B lymphocytes, the other common cell type found within MALT lymphoma are infiltrating T lymphocytes. A depiction of the cellular composition of MALT lymphoma, generated in Partek® Flow®, is shown in Figure 1.
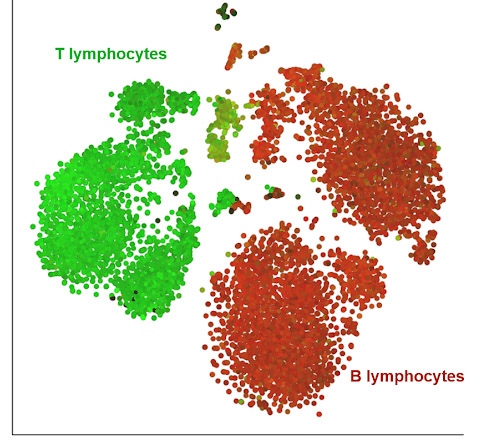
Figure 1. Cellular composition of a MALT lymphoma sample by a t-SNE chart.
Each dot represents a single cell: the entire sample consists of B lymphocytes (red), some of which are the cancer cells, and infiltrating T lymphocytes (green), which are normal cells reacting to the tumor. Cells from a dissociated MALT lymphoma were processed by 10X Genomics’ Feature Barcoding technology and can be downloaded from here. The filtered HDF5 file was loaded and processed in Partek Flow analysis software. The t-SNE is based on a combined analysis of gene and protein data for 8,018 single cells.
Although B lymphocytes are malignant cells in this type of tumor, there is a growing interest in the neighboring normal T lymphocytes. Penetration of T lymphocytes into the tumor is a reaction to cancer and is a possible therapeutic strategy. Although T lymphocytes can, depending on their type, either regulate immune response directed against the tumor or directly kill the malignant B lymphocytes, they rarely do so.
One way of exploiting the activity of T lymphocytes is to target the immune checkpoint molecules expressed on the surface of T lymphocytes, such as cytotoxic T-lymphocyte-associated protein 4 (CTLA-4). Signaling via CTLA-4 regulates the immune response and prevents autoimmune diseases and allergies, but also hinders the immune system from destroying cancer cells. Alas, only a fraction of patients are responsive to therapeutics acting on the CTLA-4 signaling pathway, which motivates the investigation of other inhibitory or stimulatory receptors.
A promising new immunotherapy drug target is programmed cell death protein 1 (PD-1). The PD-1 protein is encoded by the gene PDCD1 and is expressed on the cell surface of T lymphocytes. Ample evidence confirms that PD-1 acts as a negative regulator of the immune response. Another interesting potential target molecule is ITM2A, encoded by the ITM2A gene. ITM2A is also involved in the regulation of immune response and has recently been shown as commonly co-expressed with PD-1 (Andor et al. 2018). The list of possible therapeutic targets is much longer, and research efforts are often aimed not at individual molecules, but on their combinations and networks.
A common tool for detection of drug targets (and identification of cells expressing them) are antibodies, but – to complicate matters – high fidelity antibodies are not available for most potential drug targets. Moreover, standard analysis techniques, such as fluorescence in situ hybridization (FISH) or flow cytometry, allow for simultaneous detection of no more than 20 molecules.
The good news is that these limitations can be resolved by coupling data analysis in Partek Flow software with single cell RNA-Seq using the Feature Barcoding approach. For instance, take a look at Figure 2, which shows an ideal target for immunomodulation: a target population of “helper” T lymphocytes (positive for CD4 protein) expressing both PDCD1 and ITM2A immunoregulatory genes.
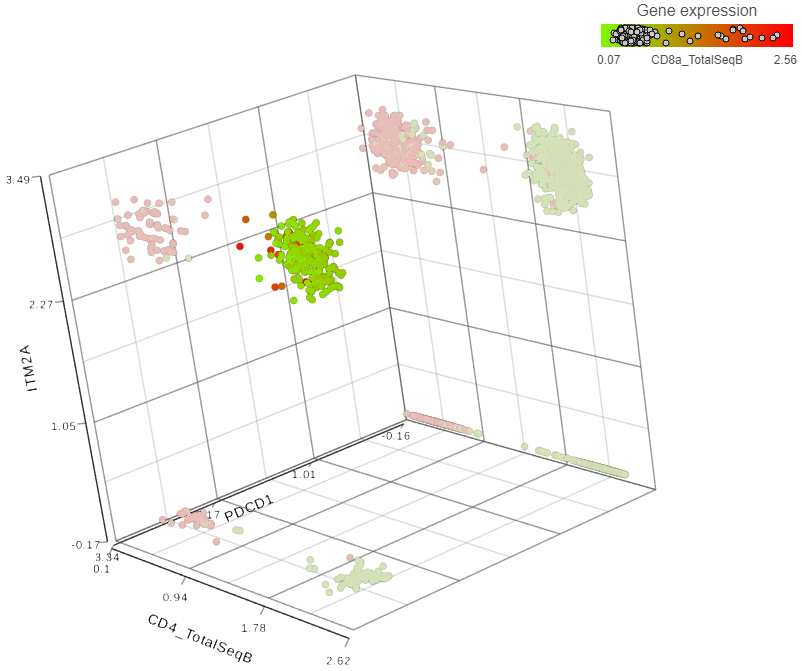
Figure 2. Detection of helper T lymphocytes co-expressing two immunomodulatory genes: PDCD1 and ITM2A
Each dot is a single cell. Cells from a dissociated MALT lymphoma were processed by 10X Genomics’ Feature Barcoding technology and can be downloaded from here. The filtered HDF5 file was loaded and processed in Partek Flow. The data points are based on the combined analysis of gene and protein data for single cells. T lymphocytes were identified as cells expressing CD3 antigen. A total of 3,069 CD3-positive cells were gated and then charted by expression levels of PDCD1 and ITM2A mRNA, and CD4 protein. To highlight the helper T lymphocytes population, the plot was then colored by expression levels of CD8 antigen, a cytotoxic T lymphocyte marker (red cells in the background).
Analysis presented above can be performed in Partek Flow software with just a few mouse clicks. If you are curious, don’t hesitate to ask for a demo or apply for a free trial.