One of the main goals of both the Single Cell RNA-Seq and bulk RNA-Seq pipelines is to detect differentially expressed genes. There are many available tools from which to choose such as DESeq2 and limma, as well as classic statistical tests like ANOVA or Welch’s ANOVA. Thus, a frequent question is which to choose?
When discussing data analysis with our customers, I often hear that “this” or “that” approach has been suggested to them by others, because it is “better”. “Better” is quite difficult to define but typically leads to a conclusion like “I found more significant genes with this test”. Having a research scientist’s background, I certainly understand the appeal of more targets, but is this necessarily something for which to strive? Spoiler alert: no, you should find the right genes, not just more genes.
Finding the right genes is where the hurdle models come into play. Hurdle models are a class of statistical models developed for count data, with the idea of handling zero-inflation and overdispersion. Sounds exactly like single cell RNA-Seq data, right? (If you are interested in the mathematics, you may want to go over this excellent overview of single-cell RNA-Seq bioinformatics)
We can think of a hurdle model as a two-question process: is a gene detected in the project or not, and if yes, has the expression level hurdle been crossed? Note that if we observe zero counts for a gene, this does not necessarily mean that the gene is not expressed. Expression may not have been detected because sequencing was too shallow or for a number of other technical reasons (e.g., sampling error, reverse transcription inefficiency, etc.). That phenomenon is known as “gene dropout” and hurdle models that that into account.
To illustrate the advantages of hurdle models in the context of Single Cell RNA-Seq, I am going to present an example based on the Model-based Analysis of Single Cell Transcriptomics (MAST) algorithm. The data originates from Shalek et al., who prepared Single Cell RNA-Seq libraries from primary mouse dendritic cells and stimulated them with three pathogenic components. I downloaded the TPM-normalized count matrices from here and extracted the data for unstimulated cells (n = 96; control) and cells stimulated with lipopolysaccharide (LPS; these are molecules found in some bacteria) for 6 hours (n = 96) (27,723 genes each). After that, I removed the genes with zero counts in at least 90% of the cells and log2-transformed the expression values (with the offset of 0.001). Finally, I proceeded to detect differentially expressed genes by either MAST or limma-trend (default settings). Significant genes were selected by applying the cut-off of false discovery rate of 0.05 and fold change > |2|.
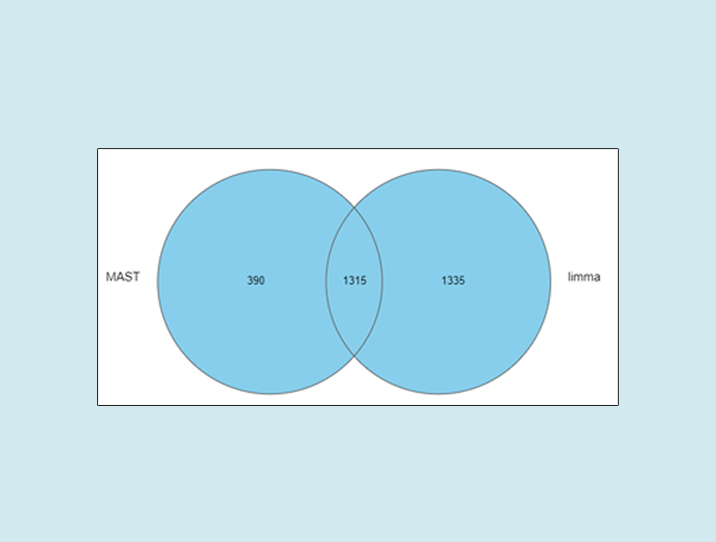
As we can see, the number of significant genes reported by MAST was lower by roughly one-third (Figure 1).
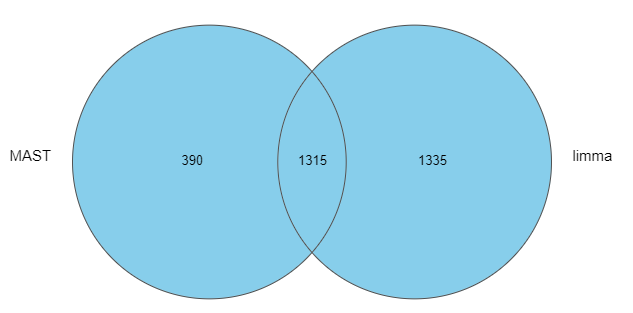
Figure 1: Number of significant genes reported by MAST and limma on the same single-cell RNA-Seq data (default options)
However, have a look at the results of the pathway enrichment invoked on the significant genes (Figure 2). The enriched pathways are not exactly the same between the two statistical models but point to the same biological direction; dendritic cells are responsible for mounting and directing the immune response and upon activation by LPS they express genes belonging to immune signaling pathways (e.g., TNF signaling pathway) or are involved in combating specific pathogens (like Salmonella). There are some differences between the two results, which are worth mentioning. The MAST-based output includes a “C-type lectin receptor signaling pathway” and dendritic cells use C-type lectin receptors to detect LPS. On the other hand, one of the pathways in the limma output is “hepatitis B”, which does not directly resonate with LPS stimulation (LPS challenge mimics bacterial, not viral infection). Furthermore, the enrichment scores are considerably higher for the MAST group, despite of fewer significant genes. In conclusion, the hurdle model helped us to focus on the right genes and to obtain more biologically relevant results, which is consistent with the conclusion of the MAST paper
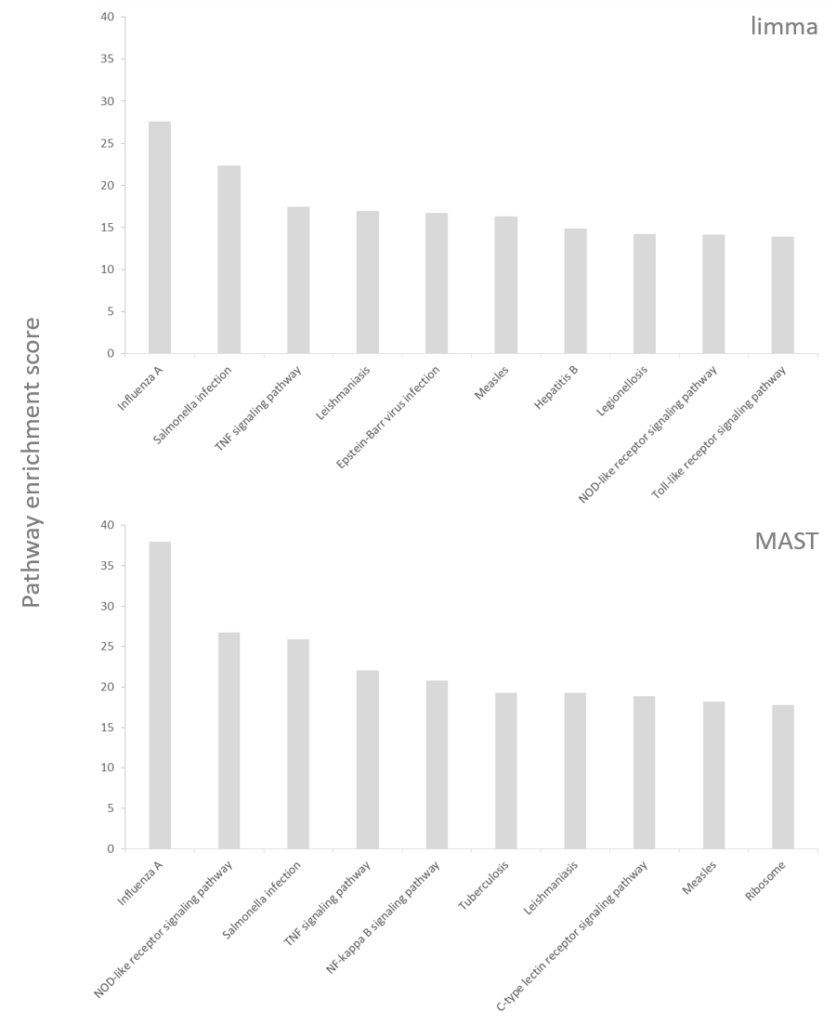
Figure 2: Pathway enrichment results (top 10) invoked on significant genes reported by MAST and limma (using the same single-cell RNA-seq data). KEGG was used as the pathway database. Enrichment scores (the higher – the better) are based on the p-value
It is important to notice that the analysis in this example was very straightforward. If you stimulate dendritic cells with LPS, you know that you will find a bunch of differentially regulated genes. But what about an experiment where the effect of the experimental factor is not as well defined and predictable? Like development, tissue regeneration, or cancer? In all those cases it is easy to get a long list of significant genes, but the trick is to pick the genes that really matter. Tools like MAST can help you with that challenge and we fully encourage you to try out different analysis strategies. Good luck!