Researchers use single cell RNA-Seq trajectory analysis to reveal cell fate. In ancient Greek mythology, three ancient goddesses known as the Moirai determined each mortal’s fate at birth by spinning their thread of life. Today instead of a spinning wheel the Moirai might use Monocle, a trajectory analysis tool embedded in Partek Flow, to determine their fate. Monocle uses single cell RNA-Seq data to detect cell transitions between different cell states, in other words, revealing cell fate.
Cell differentiation is at the heart of many biological processes
A hallmark example of a cell fate study is cell differentiation. Cellular differentiation can be studied under physiological conditions (this was the topic of our trajectory analysis webinar using Monocle) or as part of a pathophysiological process. For example, we may want to dissect the cell differentiation of lymphocytes as a response to SARS-CoV-2 infection.
Taking this one step further, cancer cells are very heterogeneous, ranging from undifferentiated cells to cells resembling their normal counterparts. Therefore, their different states and transitions between them can be analyzed with a trajectory approach.
Trajectory analysis of cancer single cell RNA-Seq data
Here’s an example. In 2017, Venteicher et al. published their work on single cell RNA-Seq analysis of human gliomas (respective Partek webinar is here). For this short article, we used a subset of that study, i.e., four oligodendroglioma samples (3,000 cells in total), and ran trajectory analysis.
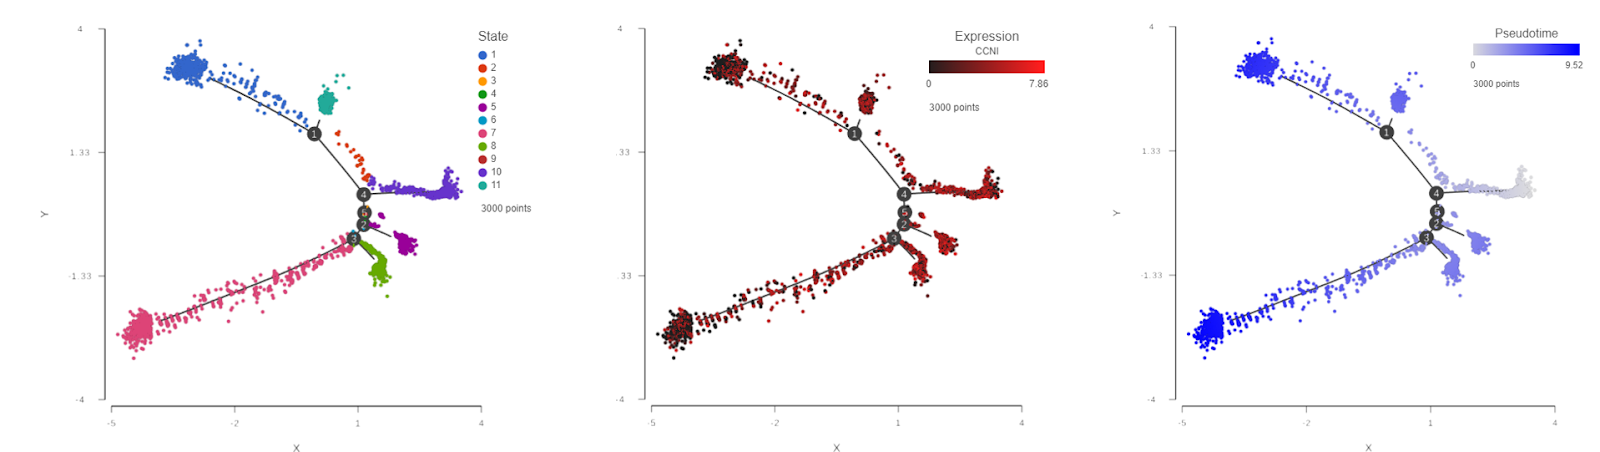
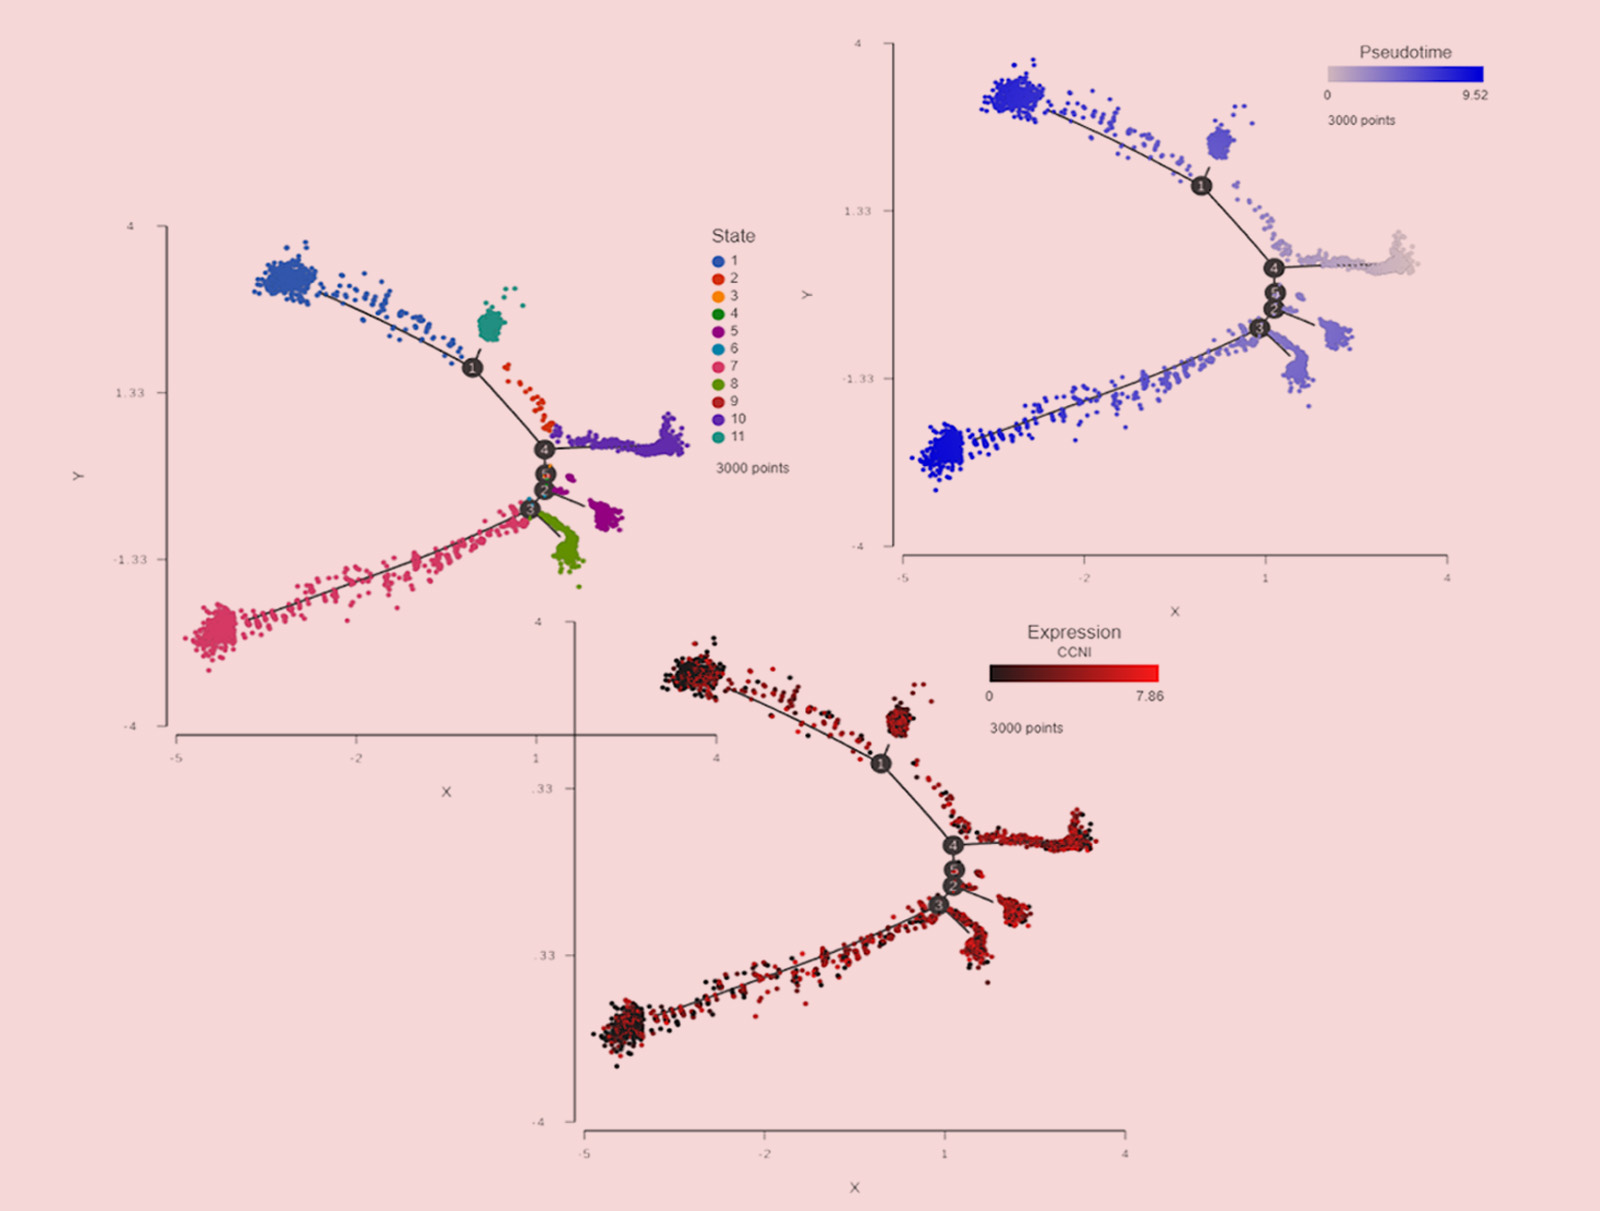
Trajectory analysis of single cell RNA-Seq data collected from 3,000 oligodendroglioma cancer cells (each dot is a single cell). The cells are colored by differentiation state (left), the expression level of cyclin I (center), and pseudotime (right).
By looking at the left panel in this figure, we can immediately appreciate the complexity of this cell population: eleven different states (sub-populations) were detected. Each subpopulation is characterized by a unique gene expression pattern. An interesting gene in this context is the cyclin I gene (CCNI), a member of a gene family tightly associated with the cell cycle. High expression levels are observed on the right side of the plot, such as state 10, while the levels of CCNI decrease as we traverse down the cell differentiation tree represented by the black lines. Knowing the pattern of gene expression (i.e., genes being turned on / switched off), we can reconstruct the differentiation sequence from early to final states. That information is shown on the right panel where the cells are colored by pseudotime. The beginning of pseudotime is indicated by a very light blue and becomes brighter as time progresses. Note the complementarity of the CCNI expression and pseudotime patterns. As the cancer cells become more differentiated (=similar to the healthy cells), the activity of cell cycle genes goes down. What if a new drug or treatment would affect the cancer cell differentiation? Since cancer differentiation is typically tied with improved survival rates, a drug with the ability to promote differentiation is well worth reviewing.
Other applications of trajectory analysis
We encourage you to explore the use of trajectory analysis tools not only for obvious purposes where cell differentiation is of primary interest, such as developmental but whenever you are looking at cells that can be classified into sub-groups, which in turn, can be organized in a before-after relationship.
Or, to rephrase: a Greek hero was bound by the verdict of the Moirai and they were not able to change their fate and (most often!) escape their doom. On the other hand, software tools are not Greek heroes, so why not deviate from the routine and use them for non-obvious purposes?