Experimental data, such as single cell RNA-Seq, is frequently burdened by nuisance batch effects, or undesirable numeric or categorical factors. Due to logistic constraints, data is often processed in different batches, e.g., different operator, different flow cell, different reagent lot and so on. If the processing batches are included in the experimental design or are relatively well balanced within the experimental conditions (for example, technician A processed half of the control and half of the treated samples, while technician B took care of the other half), their effects can be identified and removed from the data.
All the way back in the microarray era, Partek® Genomics Suite® was well known in the field for its batch remover. Now, our batch remover has been implemented in Partek® Flow® 8.0.
To illustrate the batch remover in action, I downloaded two public data sets from 10x Genomics®: 1,000 peripheral blood mononuclear cells (PBMC) from a healthy human, processed by v2 chemistry, and the same sample processed by v3 chemistry. I analyzed the data in Partek Flow (e.g., by removing dead or apoptotic cells) and identified several cell types (for an explanation of how I did it, have a look at our webinars).
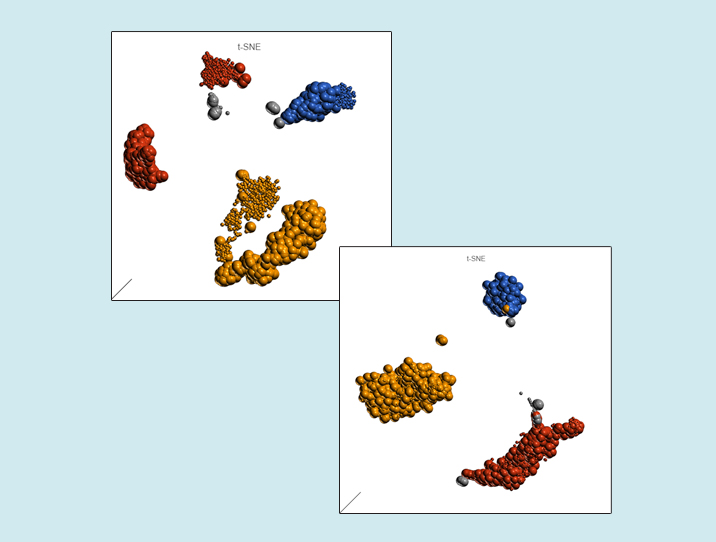
You would expect the batch effect in this project to be as large as it gets, and you would be right. The left panel of Figure 1 shows the t-SNE before the correction: the cells of each type split into two groups, based on the chemistry (instead of being clustered together). Now the good news! Once the batch effect has been removed, that pattern is no longer discernible (Figure 1, right panel): cells of the same type are grouped tightly together.

Figure 1. Effect of batch removal by Partek Flow. The t-SNE charts are based on analysis of 1,000 human peripheral blood mononuclear cells processed by two different 10X Genomics’ chemistries, thus introducing a batch effect. Each dot on the plot is a single cell. The version of chemistry is indicated by dot size. Three cell types were identified in the data set and that information is depicted using color. Some cells were not classified (N/A)
The scenario presented above, where two different chemistries were used to generate the data, can be considered as an extreme example of batch effect and it is highly unlikely that you would face it in the real world. I was using it for illustration purposes only. If the Partek Flow batch remover can handle batch effects of this magnitude, it will have no problem helping you with an actual data set.

