So, what about the Star Trek opening quote? Well, with the human genome being extensively described and studies of the proteome well underway, I believe that the glycome is the final frontier (but then again, who knows… maybe just the next frontier?). Moreover, glycomic research has profound practical consequences due to the key role of protein glycosylation in normal physiology as well as pathophysiology. Unfortunately, there are some issues that need to be resolved, such as the need for “sensitive, robust, and affordable” high-throughput analysis techniques (Trbojević-Akmačić et al., 2016).
On the bright side, a recent manuscript provided a major step in that direction, proposing a standardized method for glycome profiling: Zou and his co-workers used lectin microarrays to obtain glycation signatures of various tissues. That was precisely the type of study I was looking for to test my hypothesis; that glycomic data can be processed using genomics tools in an easy and straightforward way.
Thus, I downloaded the normalized intensity levels of each lectin from the manuscript supplement and analyzed it with Partek® Flow® analysis software. Figure 1, based on the t-distributed stochastic neighbor embedding (t-SNE) algorithm, highlights the distinct glycome profiles of five mouse tissues harvested in the original study.
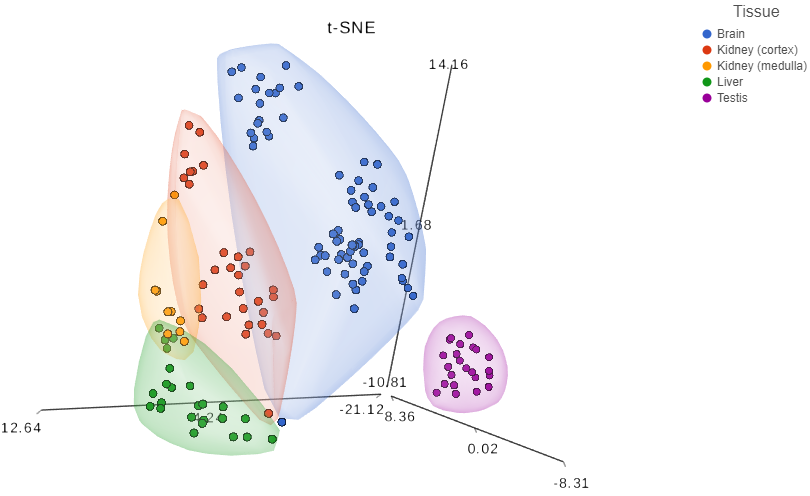
Figure 1. t-Embedded stochastic neighbor embedding analysis of normalized lectin microarray data. Each data point corresponds to one tissue fragment and the original features are intensity signals of the 45 lectins present on the array. Data provided as a supplement to Zou et al., Scientific Reports 2017.
This is in line with the results by Zou and his colleagues, but there is a difference that I would like to point out. In the original manuscript, one of the techniques used for differential glycomic profiling was principal components analysis (PCA). Although PCA visualization (Figure 2) leads to the same conclusion, that each tissue has a characteristic glycome fingerprint, the t-SNE (Figure 1) provides a cleaner tissue separation and emphasizes the point in a more convincing fashion.
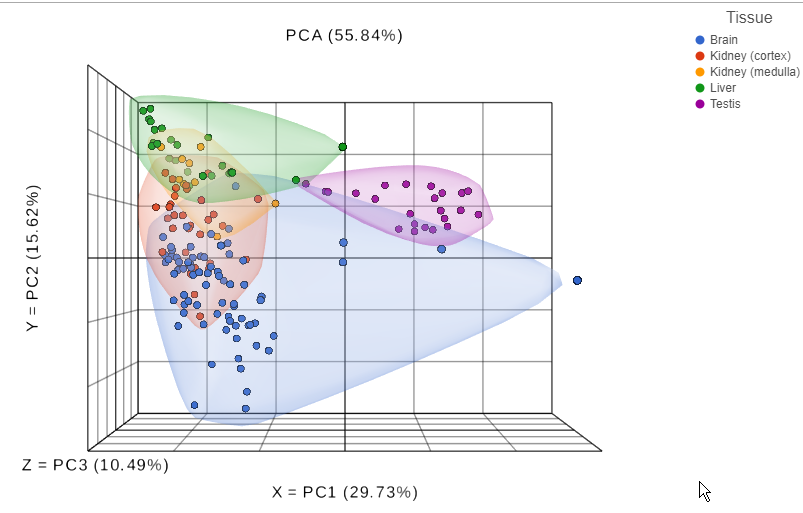
Figure 2. Principal components analysis of normalized lectin microarray data. Each data point corresponds to one tissue fragment and the original features are intensity signals of the 45 lectins present on the array. Data provided as a supplement to Zou et al., Scientific Reports 2017.
Partek is best known for our expertise in genomics, however, our tools empower you with the flexibility to examine any type of -omics data. Join us in the journey where no man has gone before.