Next generation sequencing has enabled us to ask questions about biology and disease with unprecedented scope and detail. High-throughput assays are available to study many aspects of genomic regulation including RNA-Seq for gene expression, ATAC-Seq for chromatin accessibility, and ChIP-Seq for protein binding sites.
Bringing together multiple genomic assays to analyze both the epigenome and transcriptome in the same samples promises to uncover the mechanisms underlying biology and disease. But while performing the experiments requires good hands and persistence, the real challenge begins after you receive the data. How do you make sense of it all?
Unfortunately, most analysis pipelines and tools are built for one genomic assay, leaving it to you to piece together disparate output spreadsheets and data files to figure out how the results from different assays mesh to form a coherent picture.
At Partek®, we make multi-omics integration analysis and integration seamless by bringing all your analysis tools and data together in Partek® Flow®.
To illustrate how easy it is to analyze and integrate multi-omics data in Partek Flow, I took a quick look at some data from a recently published study. In the study, the authors used ChIP-Seq and RNA-Seq data to characterize TGF-β signaling through the SMAD2/3 transcription factors.
By analyzing the data in Partek Flow, I was able to quickly go from raw data to integrated results. I identified potential direct targets of SMAD2/3 – genes that were nearby SMAD2/3 binding sites and differentially expressed after TGF-β treatment – by analyzing the RNA-Seq and ChIP-Seq data together.
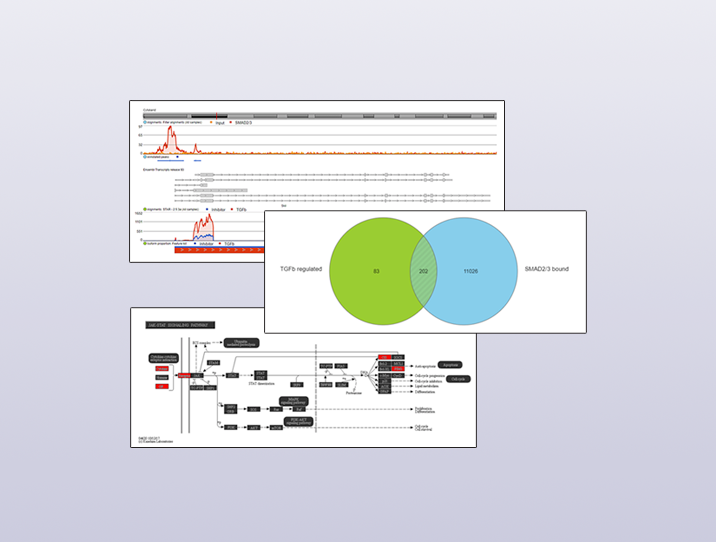
For the RNA-Seq data, I found genes that were differentially expressed between inhibitor and TGF-β treated conditions. This gave me a list of indirect and direct target genes of TGF-β. These genes are shown in the green circle in Figure 1.
For the ChIP-Seq data, I identified regions that were enriched in a SMAD2/3-pull down sample relative to input control using MACS2, a powerful tool for detecting enriched regions in ChIP-Seq and ATAC-Seq data. I then annotated these regions with nearby genes to give me a list of genes that were likely to have been regulated by SMAD2/3. These genes are shown in the blue circle in Figure 1.
I used the Venn diagram tool in Partek Flow to find the intersection between the TGF-β regulated genes and the SMAD2/3 bound genes – the 202 potential direct targets of SMAD2/3 in the experiment.

Going a step further, I performed pathway enrichment analysis on the list of direct target genes to find pathways that were likely to be quickly impacted by signaling through SMAD2/3. You can see one of the annotated KEGG pathway maps I generated using Partek Flow in Figure 2.

I also visualized several of these direct target genes in Partek Flow. Figure 3 shows Skil, a known target gene of SMAD2/3 signaling, in the Partek Flow genome browser. The top track is the ChIP-Seq data. The ChIP-Seq reads histogram shows that the SMAD2/3 pull-down sample is enriched relative to the input control. The bottom track presents the RNA-Seq data, where the TGF-β treated condition showed higher expression of the gene than the inhibitor-treated condition.
The predicted SMAD2/3 binding site for this gene is directly upstream of the transcription start site of Skil in the promoter region, illustrating why it was identified as a direct target of SMAD2/3.

To learn more about how to integrate RNA-Seq and ChIP-Seq or ATAC-Seq data in Partek Flow and see more results from my analysis, please check out my webinar: ChIP-Seq or ATAC-Seq Analysis and Integration with Gene Expression Data.
—
copyright of Kanehisa Laboratories. Under license from Pathway Solutions Inc.